When every scream and scare hinges on perfect timing, your haunt data must be just as finely tuned. TicketSignup’s reporting tools offer a comprehensive look at ticket sales, on-site check-ins, and detailed analytics—all at your fingertips and always easily exported at any time. Enter the “Reporting Realm” and discover how calendar-based insights can transform your haunt into an efficient, spine-chilling success.
Ghoulish Glimpses: Calendar Reports to Keep Your Haunt on Track
Calendar-based reporting gives you easy-to-understand monthly data overviews to spot trends, and more detailed daily breakdowns across a variety of reports. This helps you time marketing pushes, track revenue, and determine staffing levels to manage your haunt and finances with ease.
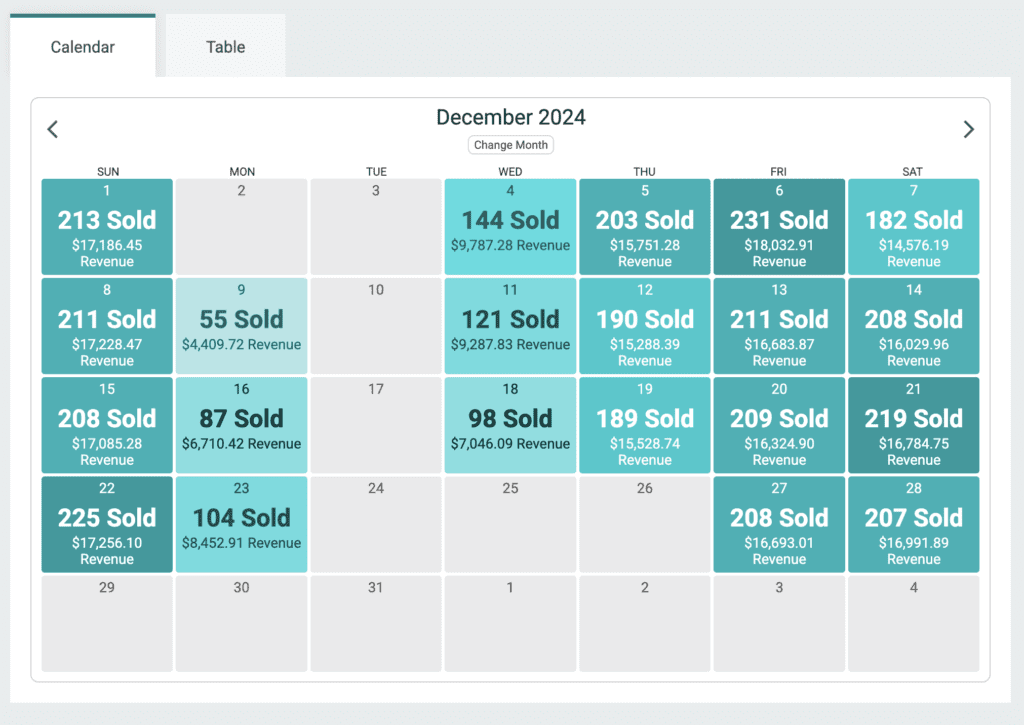
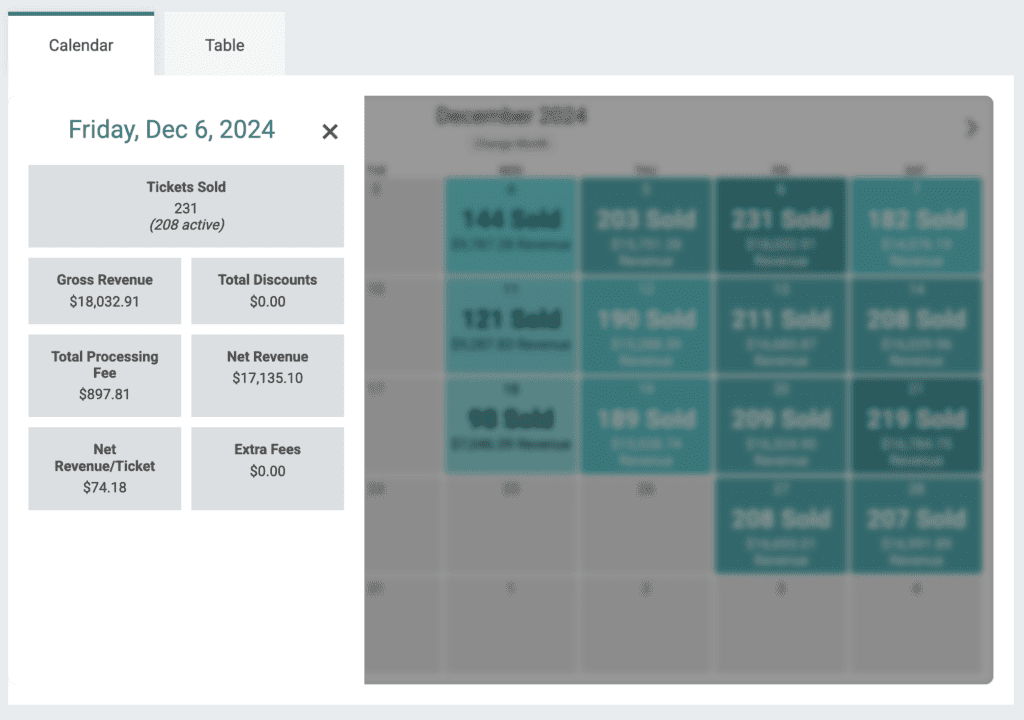
Ticket Date Sales Summary Report
Track tickets sold and revenue per night that your haunt is open. For example, track how many tickets were bought for October 13th.
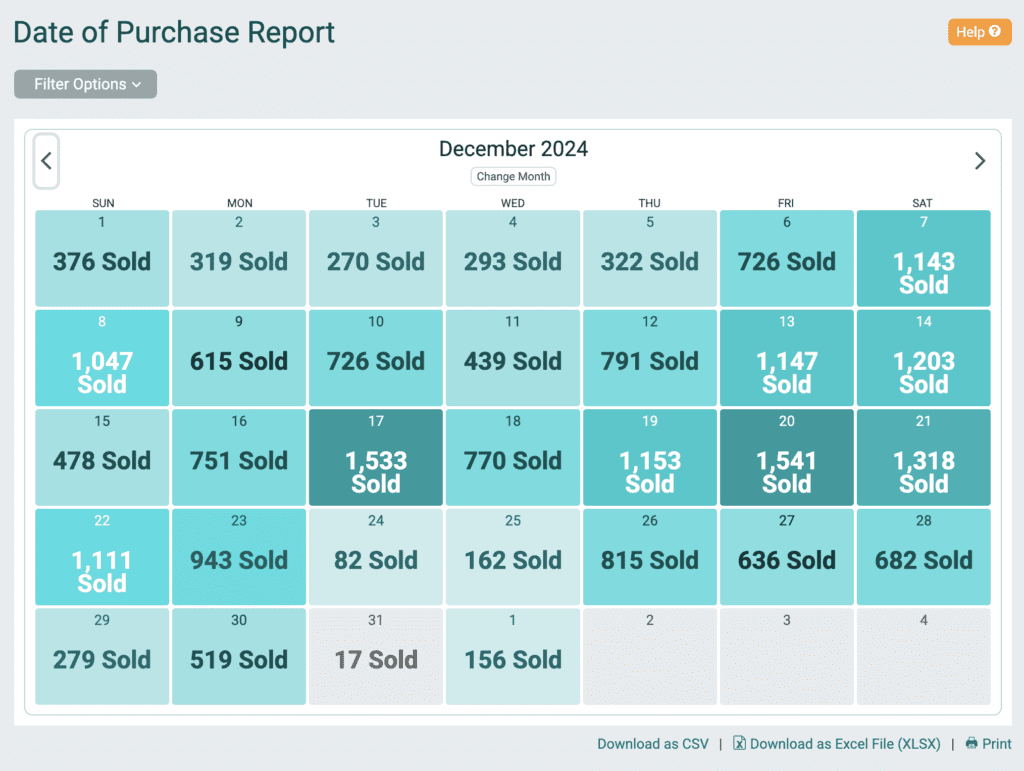
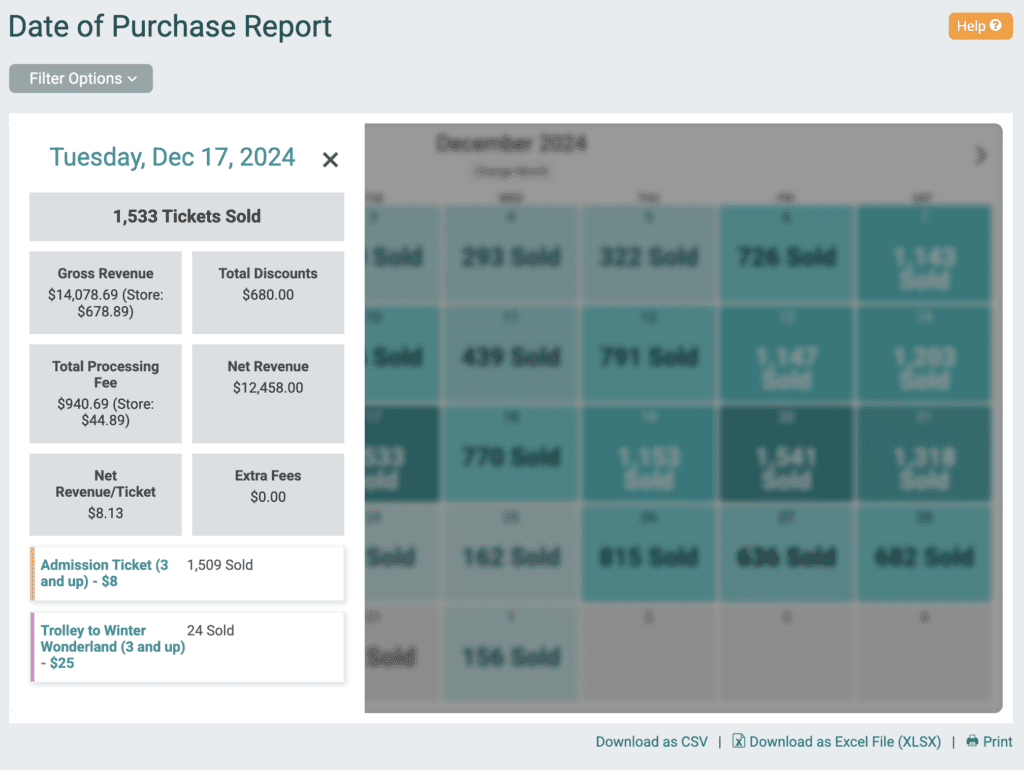
Date of Purchase Report
Track how many tickets attendees purchased per day. This lets you zoom out to look at peak purchase times and other purchasing trends.
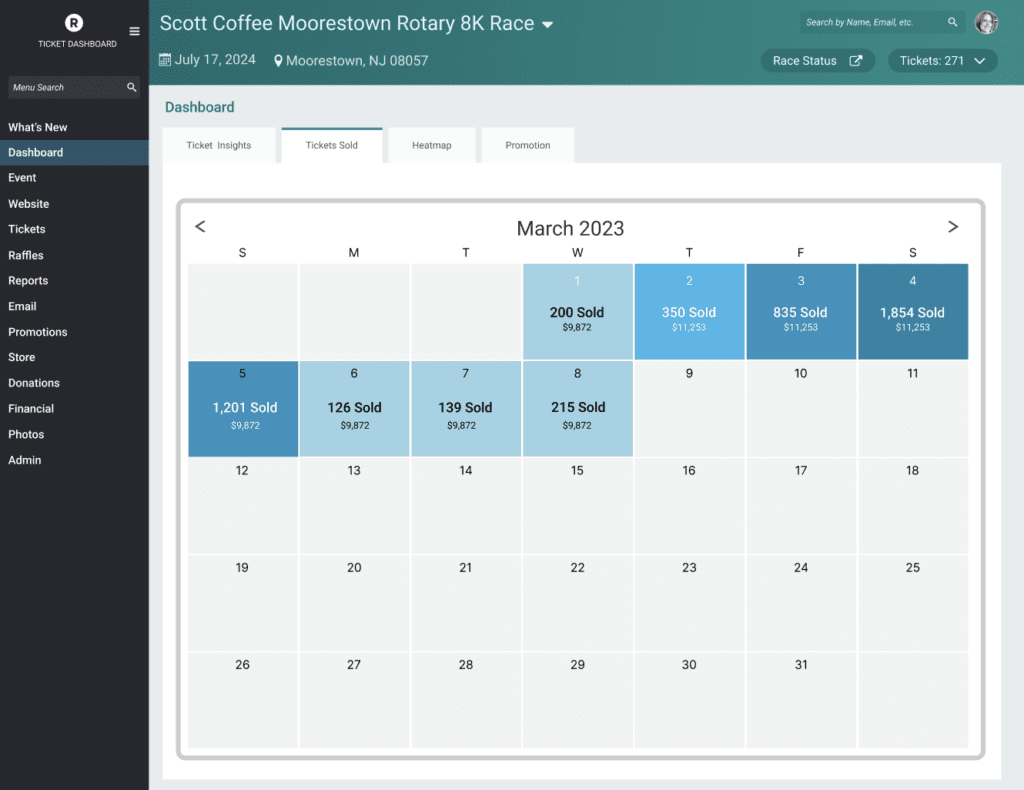
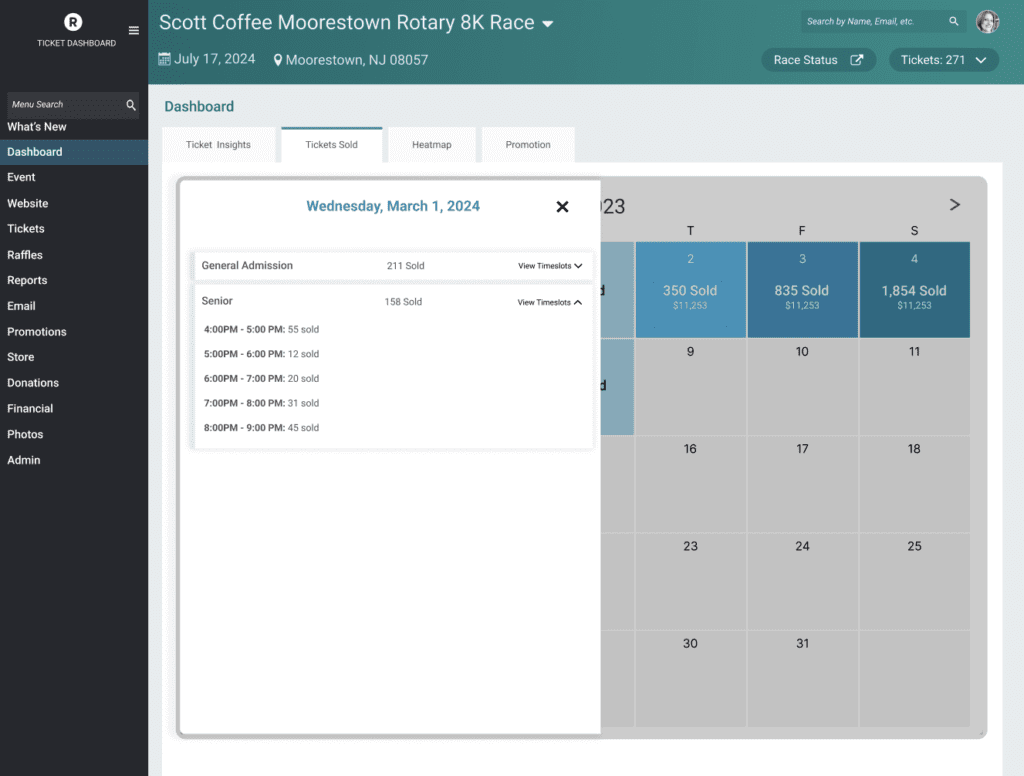
Tickets Sold
Right on your dashboard, you can track how many tickets have been sold. As this report focuses on the number of tickets sold, you can also dig into tickets sold per time slot.
Cloaked Check-Ins: Ticket App Reporting That Reveals Real-Time Attendance
Use the Ticket App for a hauntingly efficient on site process. Calendar-based check-in reporting gives you instant insight into how many brave souls have walked through your gates. Track attendee flow in real time so you’re never caught off guard by surges or lulls, ensuring every visitor gets the full frightful experience.
Ticket App Stats
Swipe across ticket types to track check-ins by time slot via the Ticket App. Don’t want all of your staff seeing overall stats? You can hide stats and only show to those you want to see.


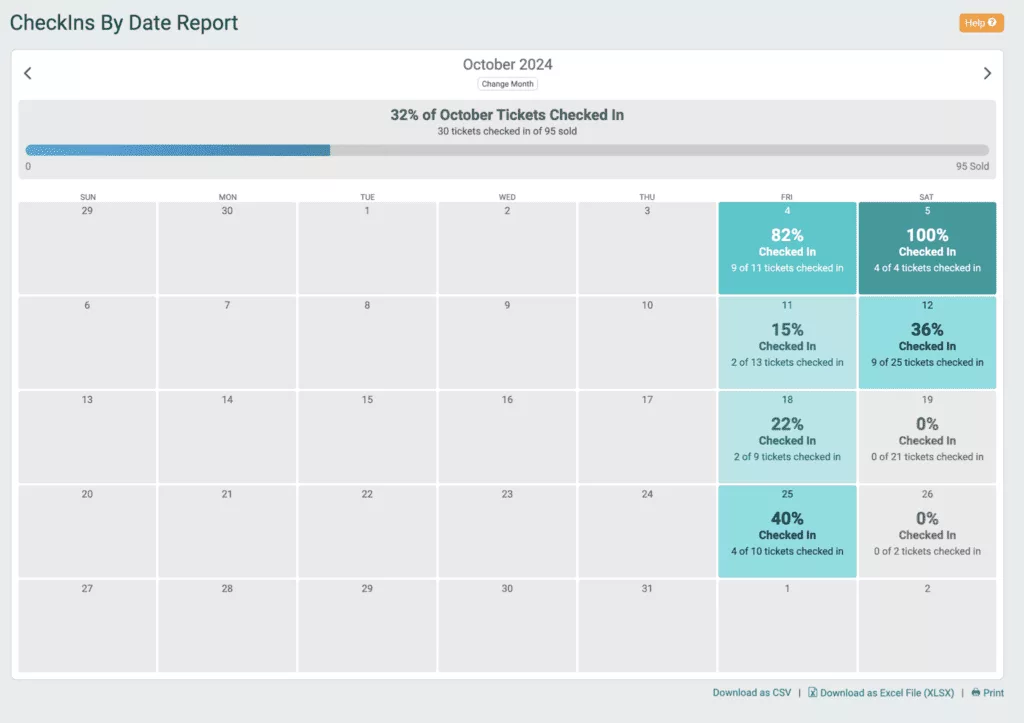
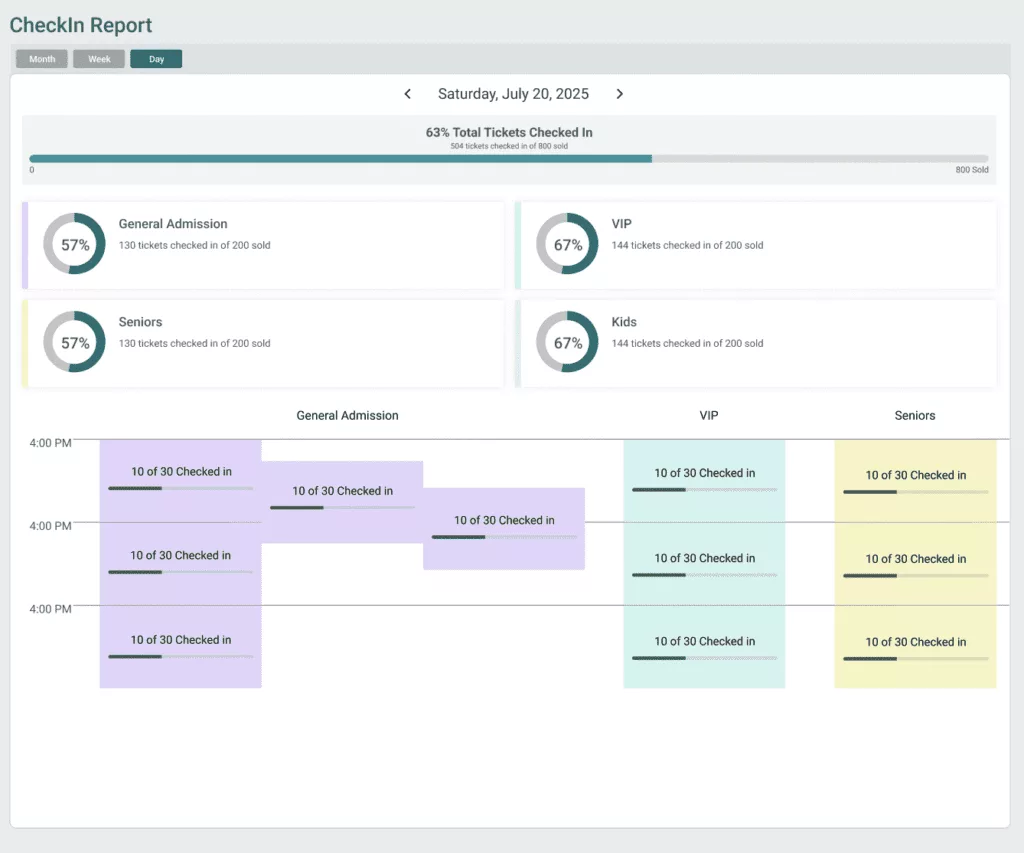
CheckIn Stats Month and Day Views
Get an overview of check-ins for your entire haunt season. This helps you adjust this year and next year’s caps and pricing. Click into a day to view more details: overall checkins for the entire day, by ticket type, and by time slot. With a unique URL, you can refresh this page throughout the night.
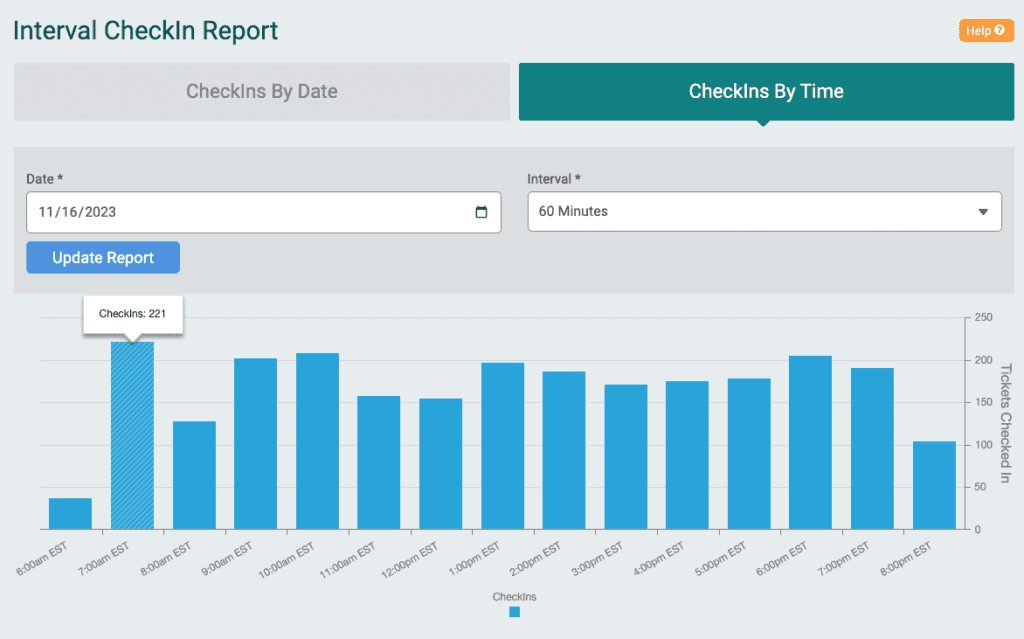
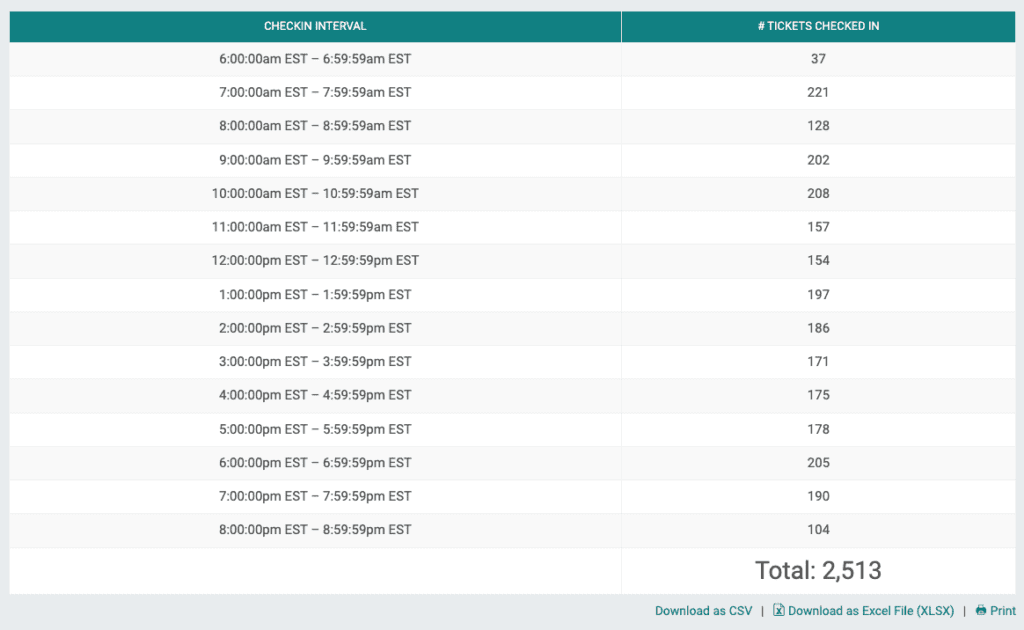
CheckIn Interval Report
Dig into the volume of check-ins by time. Choose a date and interval – hourly, 30 minute, 10 minute, and 5 minute intervals are available.
Spectral Statistics: Analytics & Insights That Light the Way to More Screams
TicketSignup’s analytics engine gives you additional insights into your haunt. Plus we have integrations Google Analytics (GA4), as well as popular digital marketing sites for enhanced ad tracking – Facebook Conversion API, TikTok Pixel, and more.
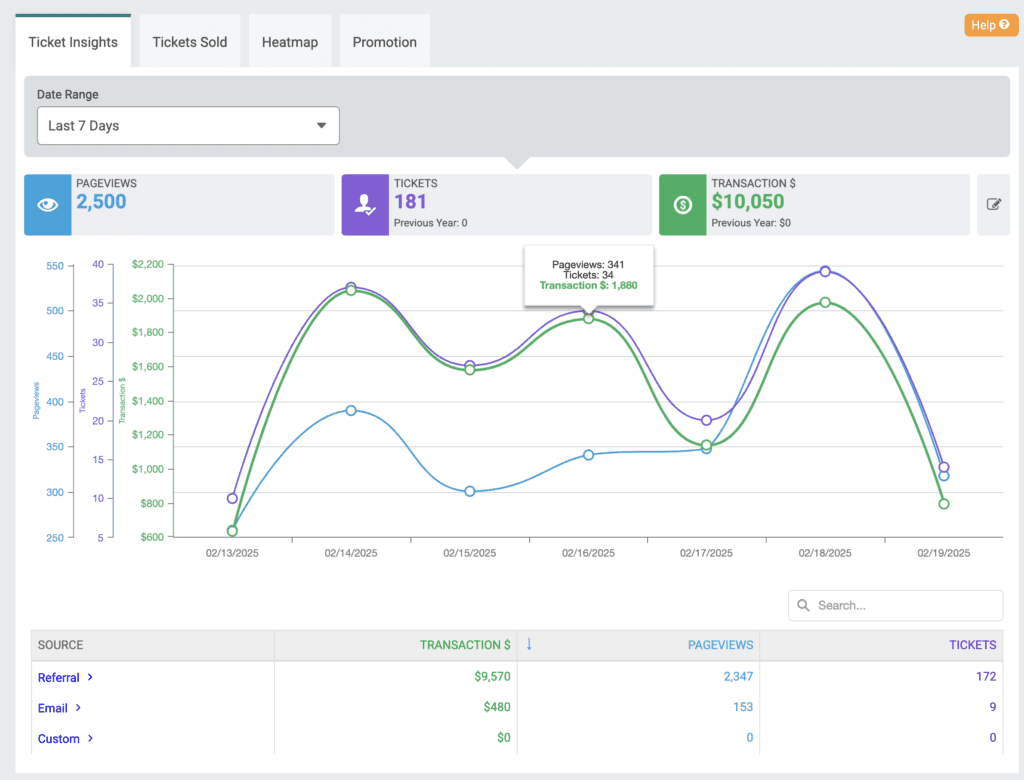
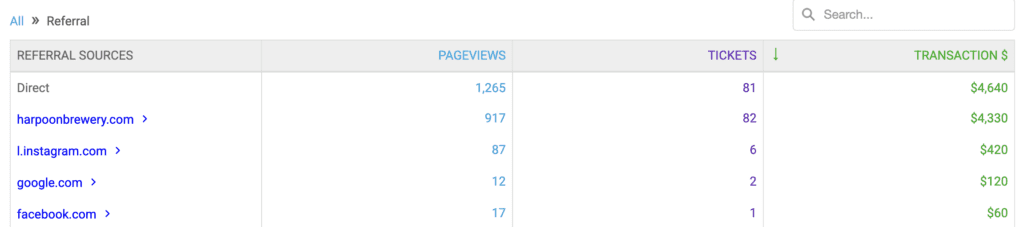
TicketInsights
Track the source of every click and purchase on your site. Understand which sites and emails drive the most traffic and the highest ticket sale conversions. You can also set up custom source tracking to generate your own links and attach to digital ads, giving you a balance between cookies used by Google, Meta, etc. and TicketSignup’s last-click attribution.
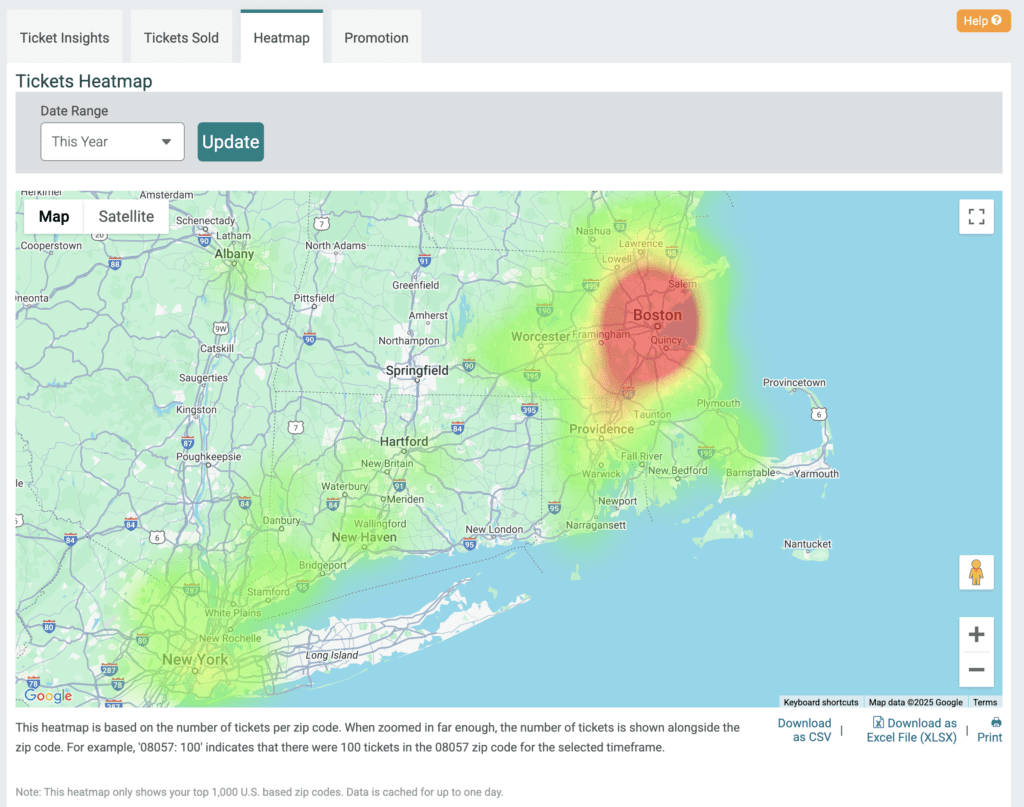
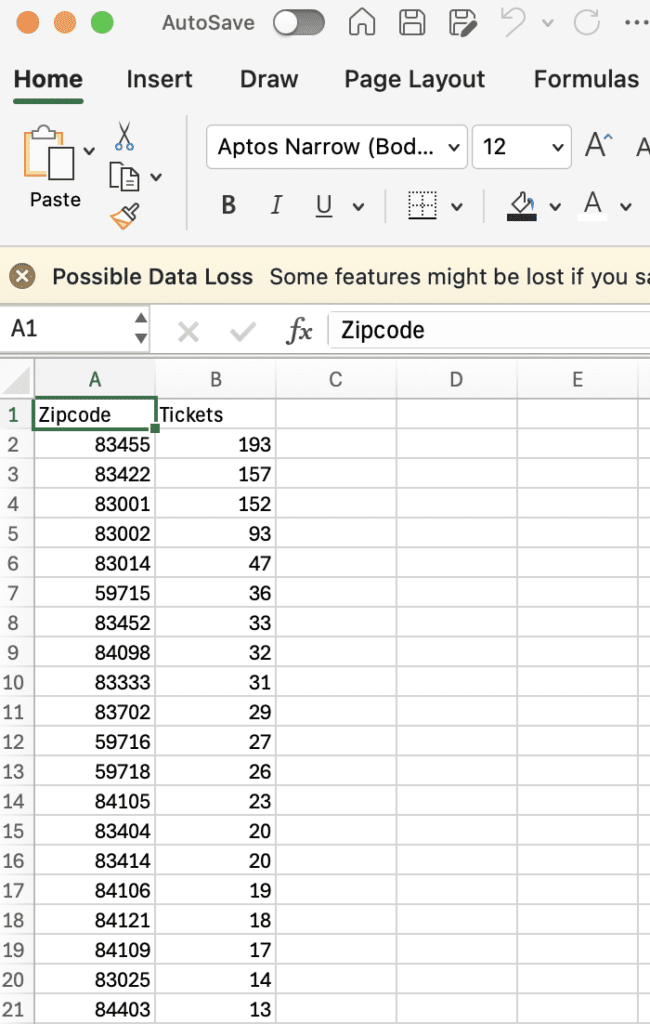
Heatmap
Understand where your attendees come from with our exportable Heatmap. Zoom in and out. Export a CSV that gives you number of tickets sold by zipcode.
Spooky Saved Reports: Flexible Ways to View and Export Your Haunt Data
TicketSignup’s reports are actionable with easy links to manage every ticket purchase. They are also highly flexible and customizable. Saved Reports let you apply filters, select columns, and choose the order that data displays in reports. This ensures that your haunt is able to view and export the data that is most important to you.

