
This analysis of 2025 haunted attraction ticketing data reveals clear patterns in attendance, pricing, and ticket purchase behavior. Most haunts run only a few nights per week across September and October, which means every operational decision, from pricing to capacity planning, can significantly impact revenue.
To better understand what drives haunt attendance and ticket sales, we analyzed 2025 ticket purchase data across 20 haunted attractions. The analysis includes attendance patterns, ticket pricing trends, purchase timing behavior, and time slot demand.
The 2025 haunted attraction ticketing data reveal several consistent patterns that haunt organizers can use to optimize ticketing strategy, pricing, and marketing.
Below are 10 key insights from the 2025 haunt season.
1. Late October Drives the Majority of Attendance
Attendance builds steadily through October but peaks sharply during the final two weekends before Halloween.
Rather than a single spike on Halloween night, the data shows a multi-week peak period leading up to October 31.
Top Haunt Dates in 2025
| Rank | Event Date | Day of Week | Share of Attendance |
|---|---|---|---|
| 1 | Oct 25, 2025 | Saturday | |
| 2 | Oct 18, 2025 | Saturday | |
| 3 | Oct 24, 2025 | Friday | |
| 4 | Oct 17, 2025 | Friday | |
| 5 | Oct 11, 2025 | Saturday | |
| 6 | Oct 31, 2025 | Friday | |
| 7 | Oct 10, 2025 | Friday | |
| 8 | Nov 1, 2025 | Saturday | |
| 9 | Oct 4, 2025 | Saturday | |
| 10 | Oct 30, 2025 | Thursday |
The two weekends before Halloween accounted for a large share of total attendance across the dataset.
This pattern reinforces the importance of planning staffing, capacity, and pricing for late October demand spikes.
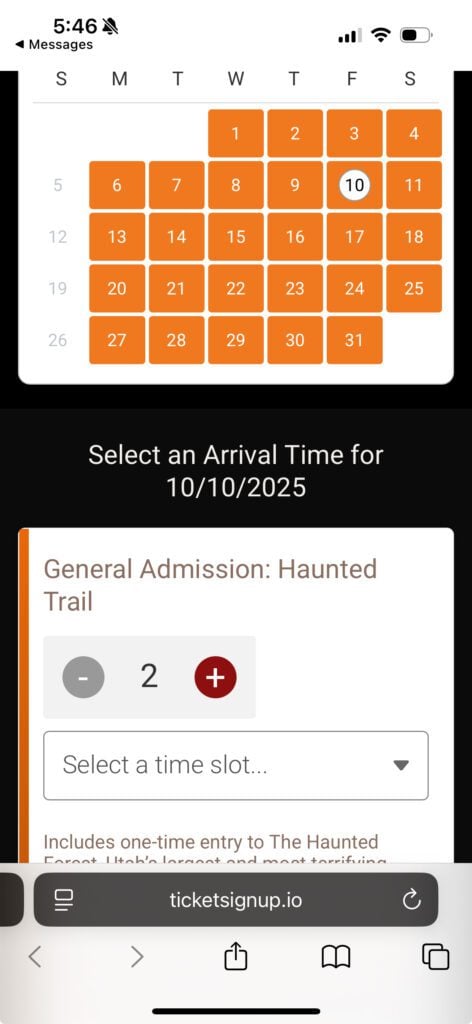
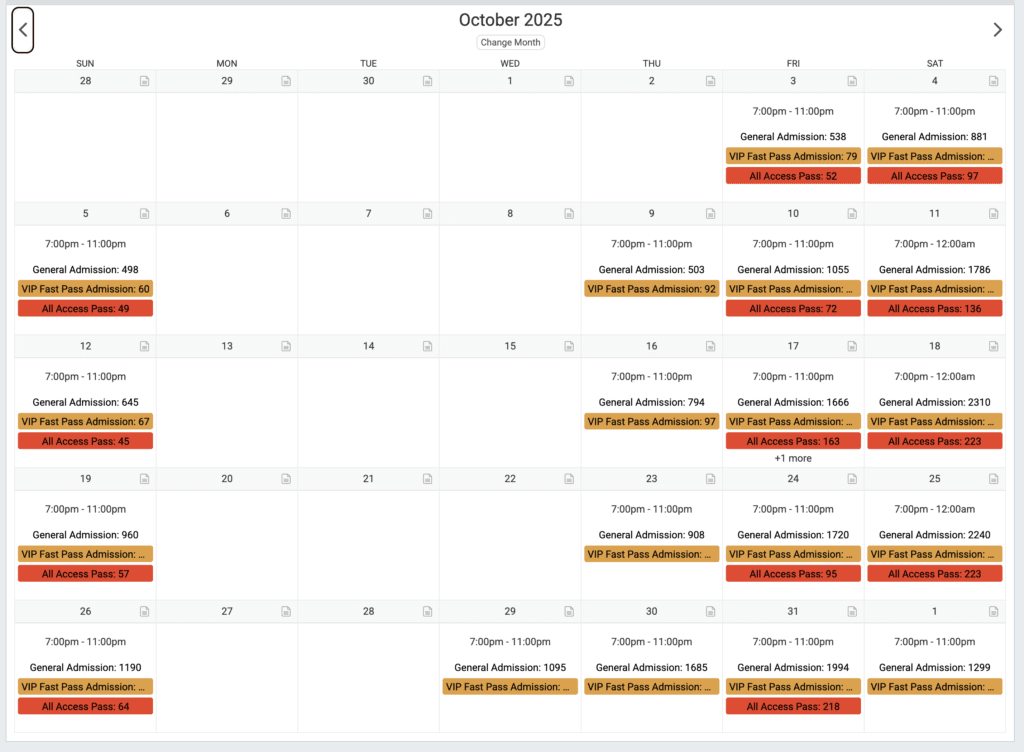
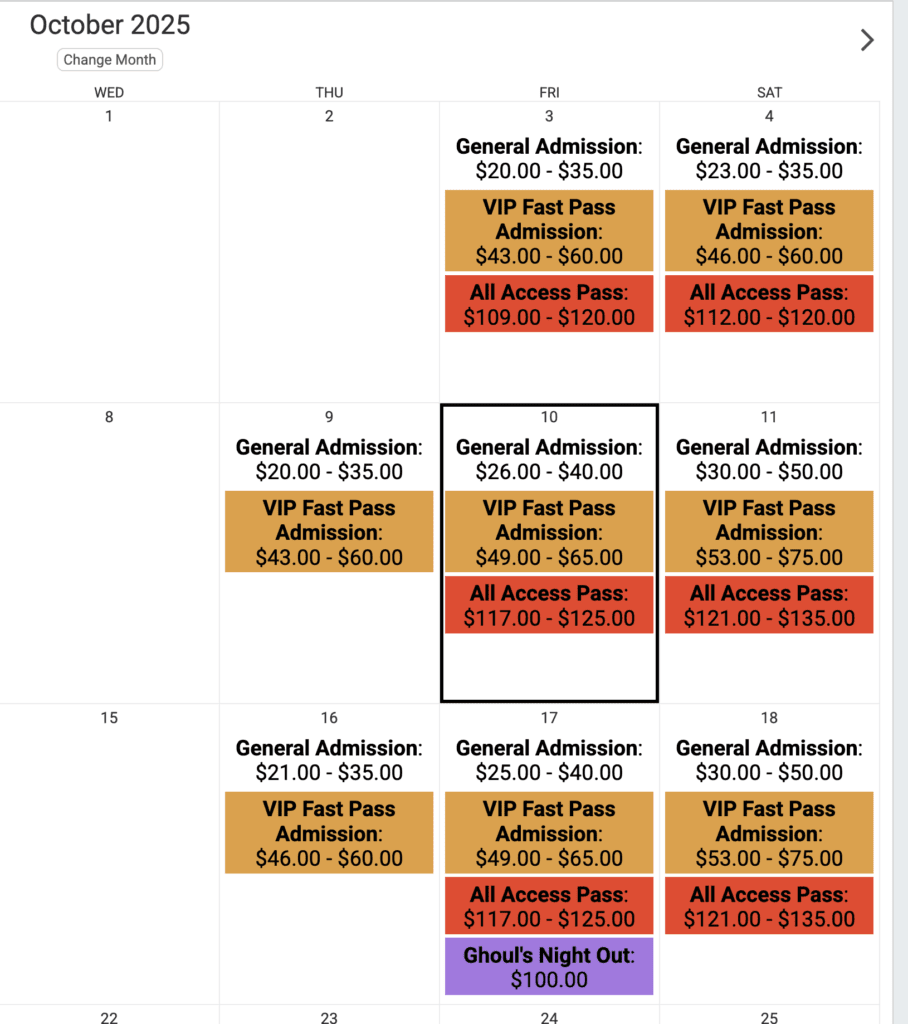
Many haunts manage these seasonal schedules using calendar-based ticketing, which allows organizers to control capacity, pricing, and availability for each night of the season.
2. Fridays and Saturdays Dominate Attendance
Haunted attractions are overwhelmingly weekend-driven.
Haunt Attendance by Day of Week
| Day | Share of Attendance |
|---|---|
Saturday | |
Friday | |
Thursday | |
Sunday | |
Wednesday | |
Tuesday | |
Monday |
Friday and Saturday alone account for 71.8% of attendance.
However, the data also shows growing demand on Thursday nights, particularly during the final week before Halloween.
This suggests that haunts can benefit from:
• Expanding Thursday operations
• Introducing special themed nights
• Adjusting pricing for late-week demand

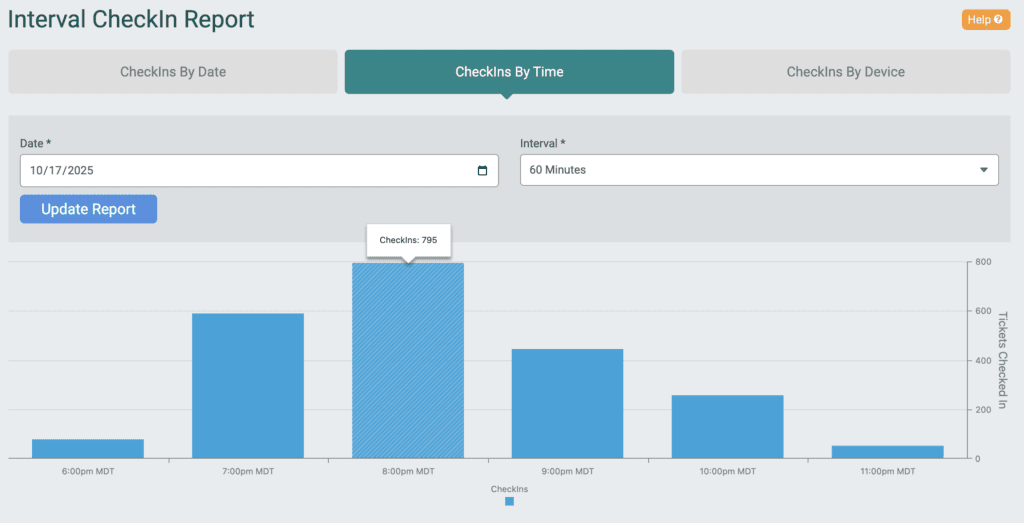
3. The 7 PM to 9 PM Window Is Peak Arrival Time
Haunts see the majority of attendance during a narrow evening window.
Attendance by Time Slot
| Time Slot | Share of Attendance |
|---|---|
Before 6 PM | |
6:00–6:59 PM | |
7:00–7:59 PM ⭐ Peak | |
8:00–8:59 PM | |
9:00–9:59 PM | |
10:00–10:59 PM | |
11 PM and later |
Nearly two thirds of attendance occurs between 7 PM and 9 PM.
Without capacity controls, this concentration can lead to long lines and inconsistent guest experiences.
Many haunts address this by offering timed entry ticketing, which allows attendees to choose specific arrival windows and spreads attendance across the evening. Have more crowds than you can handle? Check out virtual queuing to keep guests happy and spending money without feeling like they are stuck in lines all night.
4. Late Night Attendance Still Represents Real Demand
While early evening hours dominate, a meaningful portion of attendees still arrive later – and some of these are the biggest haunt fans.
Late Night Attendance
| Time Window | Share of Attendance |
|---|---|
🌙After 9 PM |
Late-night visitors often include:
• Dedicated haunt enthusiasts
• Young adult groups
• Visitors looking for shorter wait times
Some haunts use pricing incentives or promotions to encourage attendance in these later time slots.
5. General Admission Tickets Drive the Majority of Sales
Across the dataset, general admission tickets accounted for most ticket purchases.
Ticket Type Distribution
| Ticket Type | Share of Ticket Volume |
|---|---|
General Admission | |
VIP / Upgraded |
While general admission dominates volume, premium ticket options still represent an important revenue stream.
6. VIP Tickets Generate Significantly Higher Revenue Per Guest
Premium ticket tiers command significantly higher prices.
Average Ticket Price
| Ticket Type | Average Price |
|---|---|
General Admission | |
VIP / Fast Pass / Upgraded |
VIP tickets averaged approximately 75% higher than general admission prices.
Many haunted attractions offer VIP upgrades that include:
• Skip-the-line access
• Faster entry times
• Premium or add-on experiences included
Offering these premium options allows haunts to increase revenue without increasing capacity. Capture even more upsells with ticket upgrades after attendees buy tickets or when they are waiting in a virtual queue.

7. Weekend Pricing Reflects Higher Demand
Ticket prices often increase as demand rises later in the week.
Average Ticket Price by Day of Week
| Day | General Admission | VIP / Upgraded |
|---|---|---|
Monday | ||
Tuesday | ||
Wednesday | ||
Thursday | ||
Friday | ||
Saturday | ||
Sunday |
General admission prices peaked on Saturday nights, while VIP pricing was strongest across weekends. This reflects the natural demand curve of haunt attendance.
8. Same-Day Purchases Dominate Ticket Sales
Unlike many events where tickets are purchased weeks in advance, haunt buyers tend to purchase very close to their visit date.
Ticket Purchase Timing
| Purchase Timing | Share of Attendance |
|---|---|
7+ days before | |
2–6 days before | |
Day before | |
Day of event |
More than half of all tickets were purchased the same day as the event.
This behavior reflects the spontaneous nature of haunt attendance, often influenced by:
• Weather
• Weekend plans
• Group coordination
9. Pricing Strategy Can Encourage Earlier Purchases
Because many attendees buy last minute, pricing strategy can help shift demand earlier.
Common tactics include:
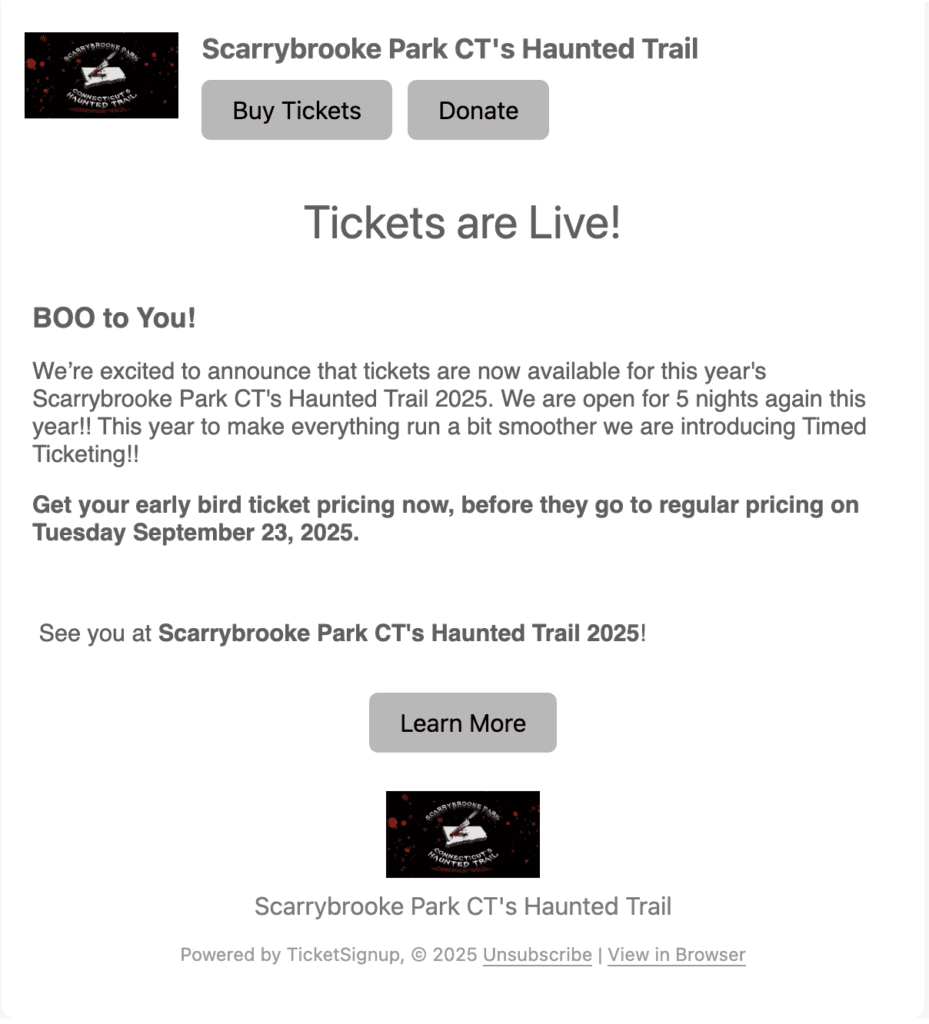
• Early-bird pricing
• Scheduled price increases before peak nights
• Coupons and discount incentives to buy early
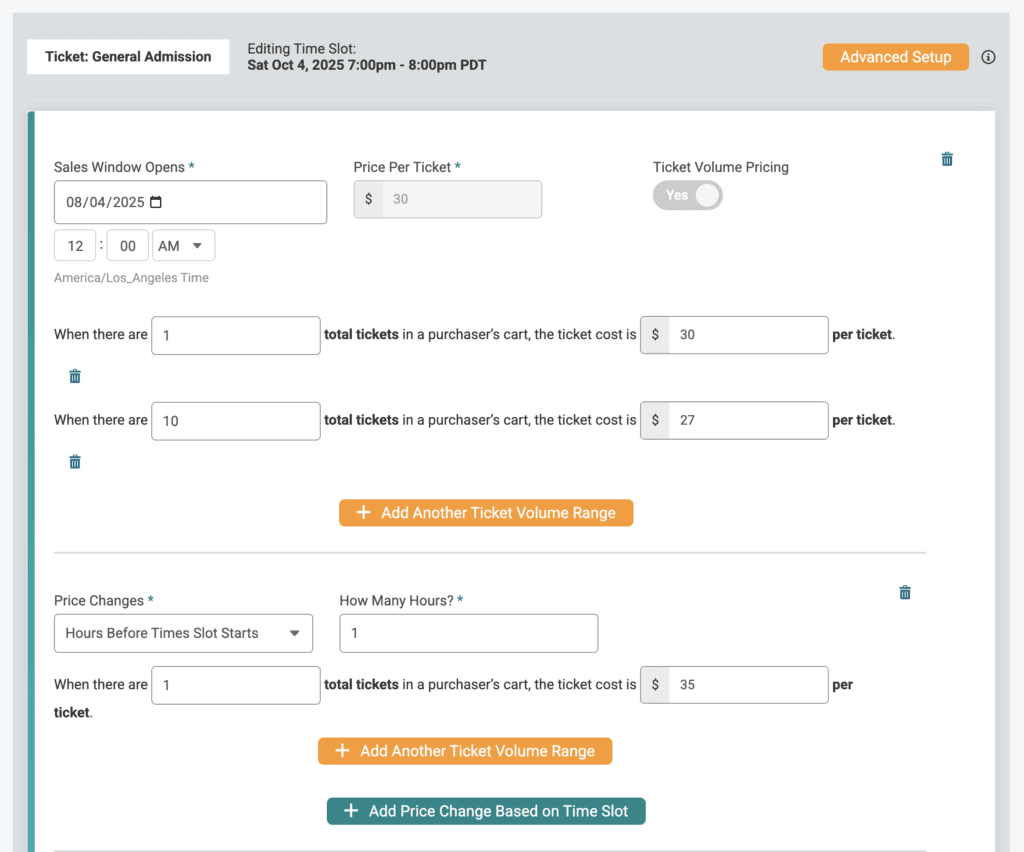
Automated pricing rules allow attractions to increase ticket prices at specific times, such as one week before the event or within 24 hours of the date. This rewards early purchasers while helping operators forecast attendance more accurately. Email Marketing, SMS, and other marketing initiatives spread the word.
10. Halloween Is Not the Busiest Night
Halloween is a strong attendance night, but it is not the busiest night of the haunt season.
Halloween vs Peak Nights
| Date | Day | Share of Attendance |
|---|---|---|
Oct 25, 2025 | Saturday | |
Oct 18, 2025 | Saturday | |
Oct 24, 2025 | Friday | |
Oct 17, 2025 | Friday | |
Oct 31, 2025 🎃 Halloween | Friday |
Several October weekends generated significantly more attendance than Halloween itself.
Many groups visit during the weekends leading up to Halloween, while Halloween night is often reserved for parties or trick-or-treating. As a result, the final two weekends of October typically represent the peak demand window for haunted attractions.
What Haunted Attraction Ticketing Data Tells Us
The 2025 haunt season data highlights a clear reality for haunted attractions. Success is not driven by a single night. It comes from managing demand across dozens of event dates in a short seasonal window.
Attendance concentrates on late October weekends, peak arrival times cluster between 7 PM and 9 PM, and more than half of tickets are purchased the same day.
That combination makes flexibility critical. Haunted attractions need the ability to adjust pricing, capacity, and availability across multiple nights while still delivering a smooth guest experience.
This is where calendar-based ticketing becomes essential. Instead of managing one event, operators can control an entire season from a single calendar, with each night functioning as its own ticketed event.
Platforms built for seasonal attractions allow organizers to manage complex operations with tools like:
• Calendar-based ticketing for multi-night seasons
• Timed entry windows to manage peak demand
• Automated price increases for high-demand nights
• VIP and upgraded ticket tiers
• Real-time reporting to monitor attendance trends
With the right ticketing infrastructure, haunted attractions can balance demand across the entire October calendar, reduce wait times, and maximize revenue during their busiest weeks.
Purple Background:Ready to Work with Haunt Experts?
Sell Haunt Tickets on TicketSignup. Our self-serve Event Wizard is fast and easy – and our team is always available to learn about your event and ensure the optimal setup.