TicketSignup makes it easy to view, export, and understand your event data. One of the best ways to understand trends and analyze data is with summary reports. TicketSignup has many valuable summary reports for ticket events, and continues to add more. We’ve added a new page for events to quickly access summary reports and analytics.
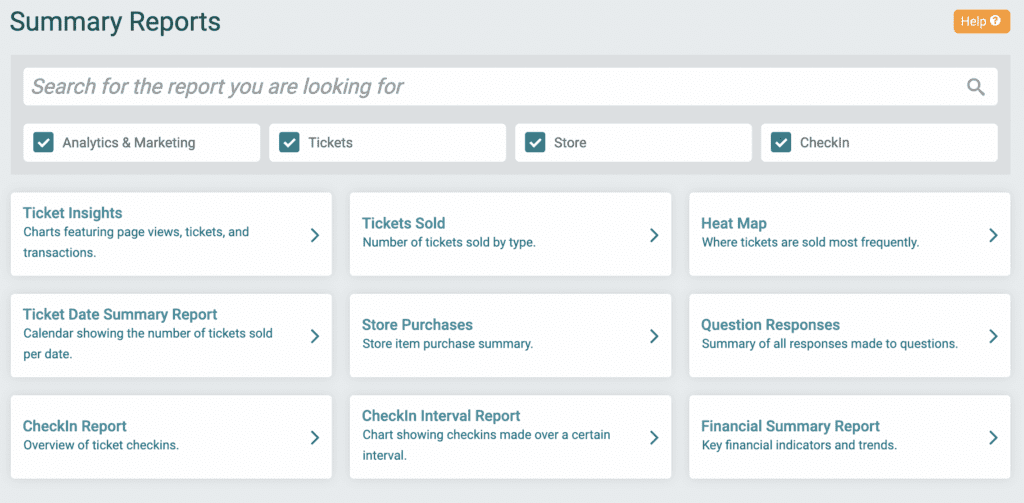
Navigate to Reports >> Summary Reports. There’s a quick search option to find any summary report. You can also filter reports by 4 main categories: Analytics & Marketing, Tickets, Store, and CheckIn. As we create more summary reports, we will continue to add to this quick search page.
Want to learn more about TicketSignup’s ticket summary reports and analytics? We feature some of the key reports and analytics in this blog. Or check out this video overview of key summary reports and analytics on TicketSignup.
TicketInsights
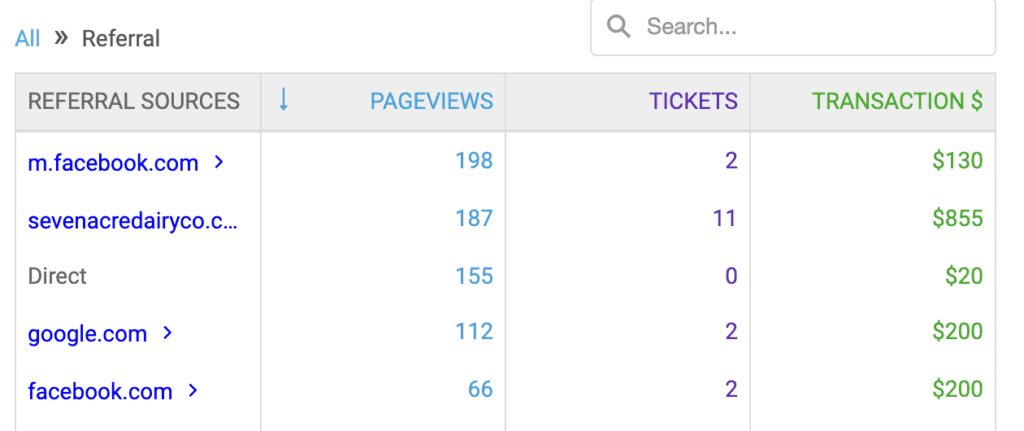
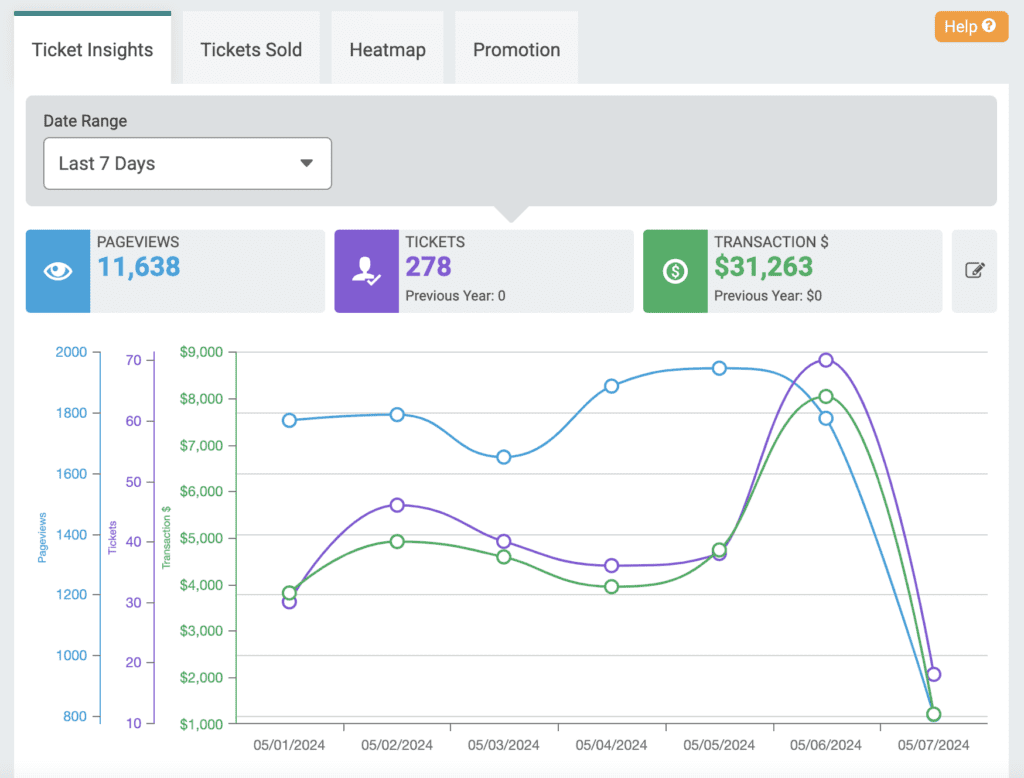
TicketInsights is TicketSignup’s purpose-built analytics engine for events. TicketSignup tracks every page view and gives you insight on the traffic source and how it converts to ticket sales. Track everything with custom source codes.
Tickets Sold
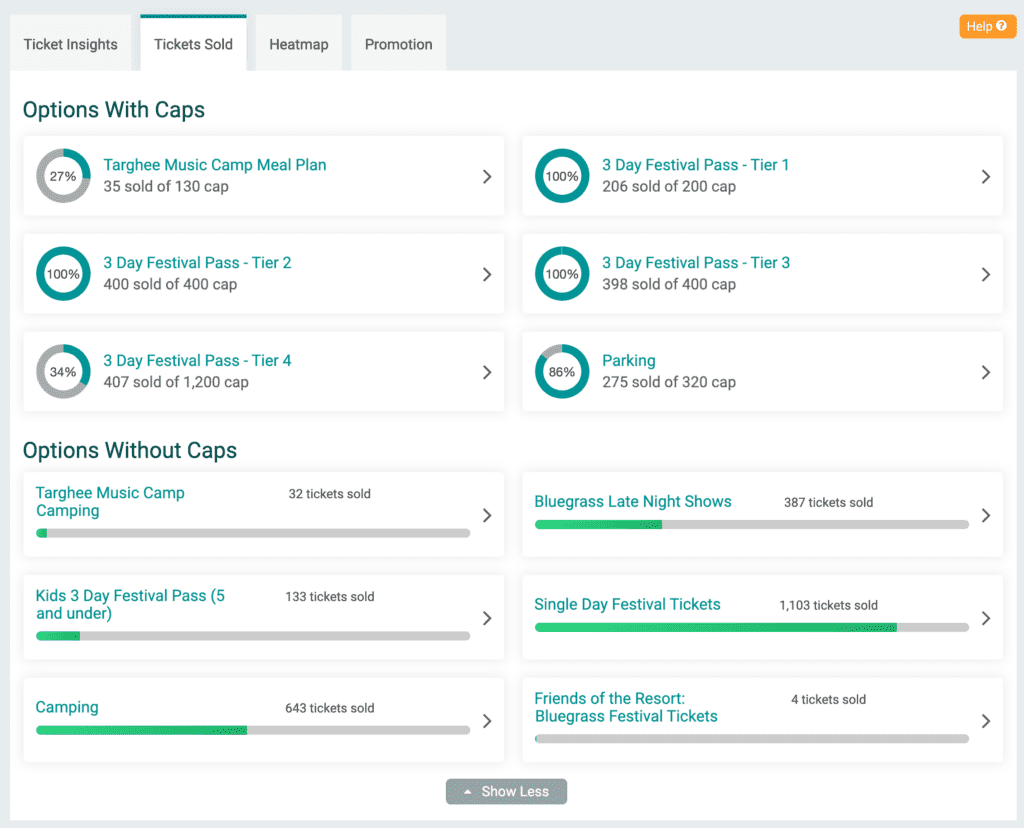
Track the number of tickets sold by ticket type right from your dashboard. The display is responsive based on whether or not you use caps for ticket types to easily track tickets sold vs. tickets still available.
Heat Map
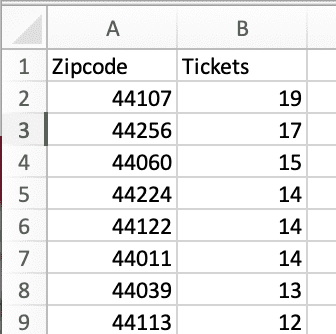
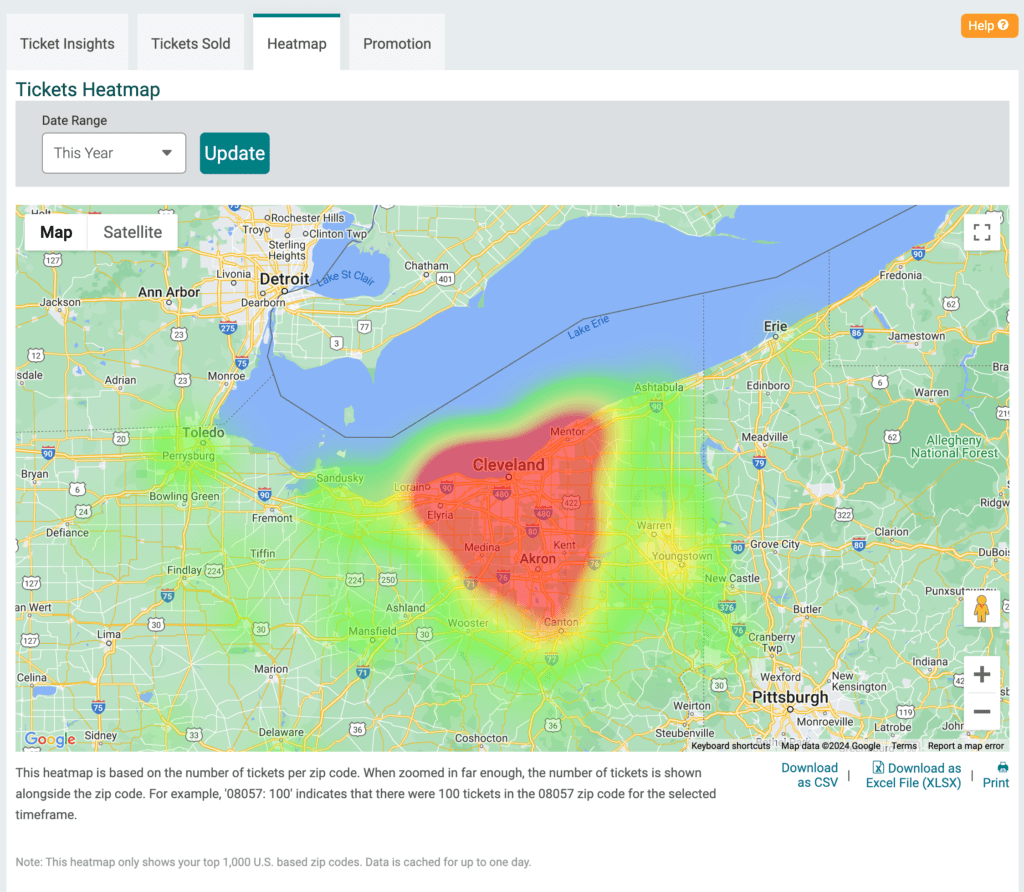
Dig into where your attendees are coming from with TicketSignup’s interactive heat map. Zoom in and out to identify where ticket purchasers live. There is also a heat map export that gives you a count of tickets per zip code. The heat map enables you to geographically target your marketing spend and efforts.
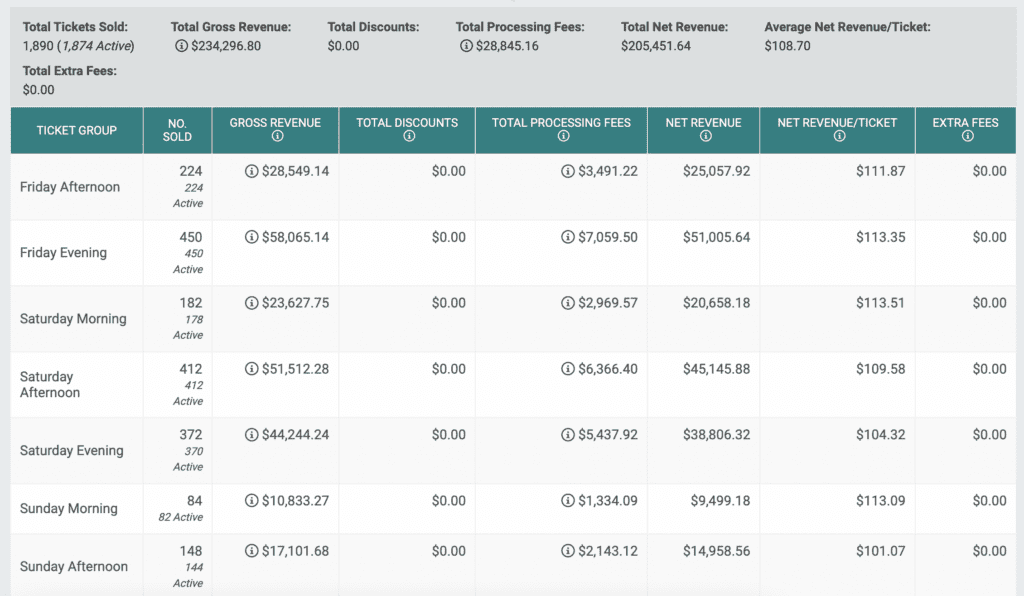
Tickets Sales Summary Report
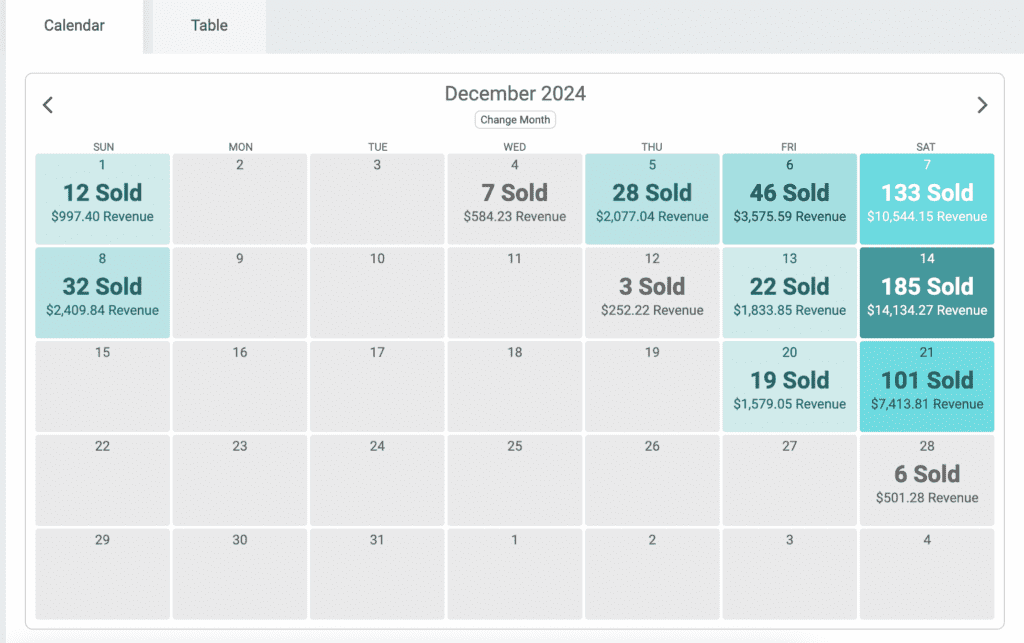
Track your ticket revenue and margins by ticket type with the Ticket Sales Summary Report. See gross revenue, total discounts, total processing fees, net revenue, and net revenue per ticket by ticket type. MTE events view their ticket sales by date with the Ticket Date Summary Report. The same data is displayed, but rolled up by date. Color coding makes it easy to understand which dates are generating the most revenue and ticket sales. A table view by date is still available.
Store Purchases
The Store Purchase Summary report provides a summary of items purchased broken down by variant (i.e. size, color, etc.). It also tracks the total items fulfilled either by the Ticket App store fulfillment or manually.
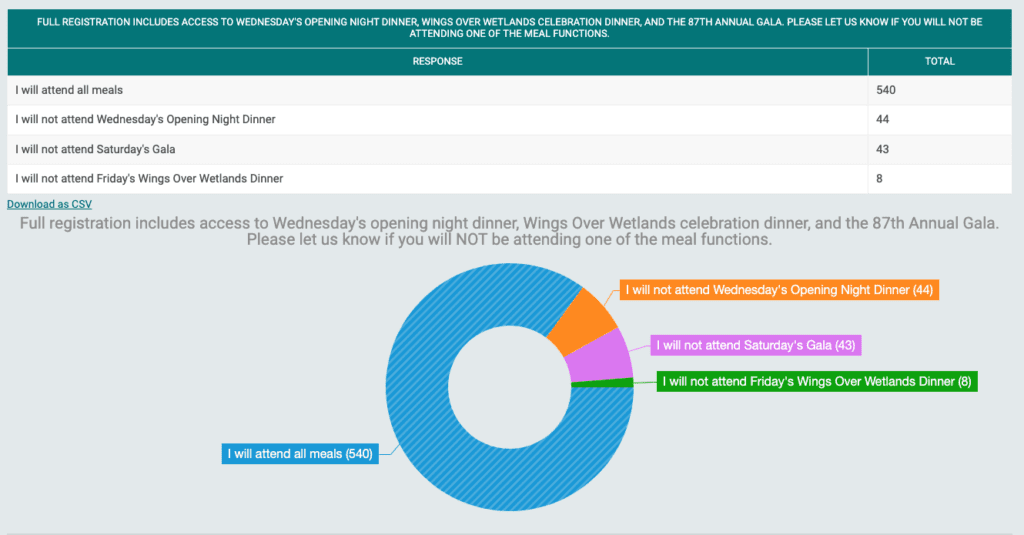
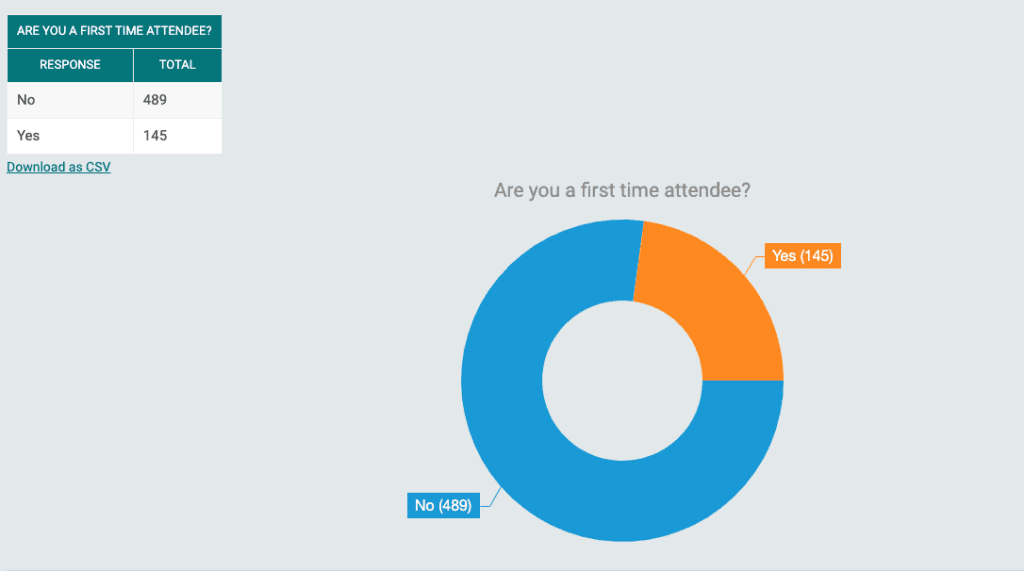
Question Responses
View and export a summary of all questions and responses that you ask attendees. Visual charts make your data easy to understand at a glance.
CheckIn Reports
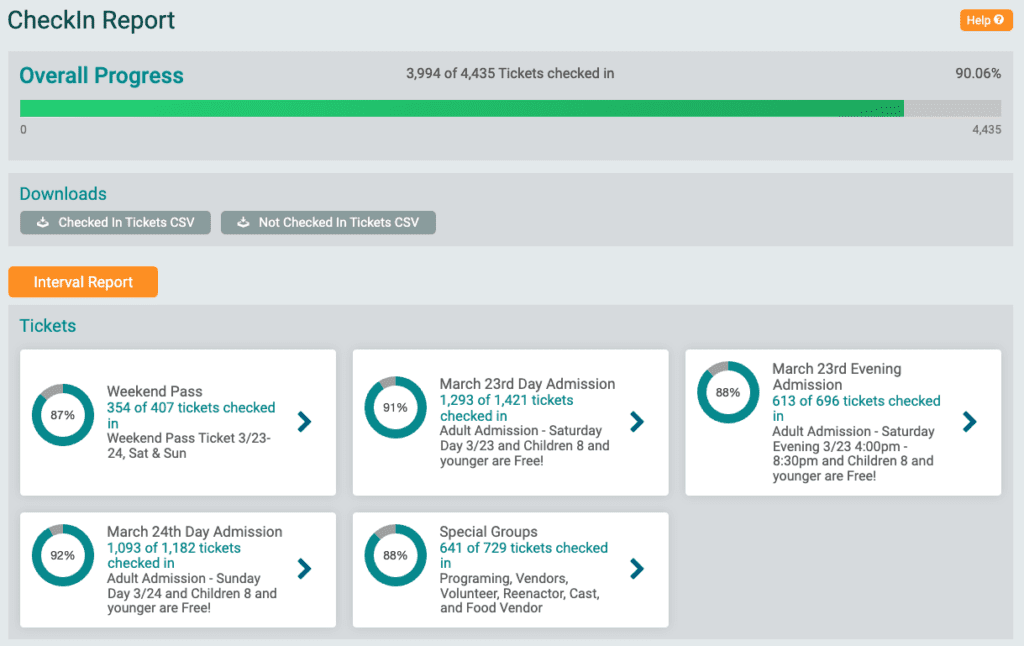
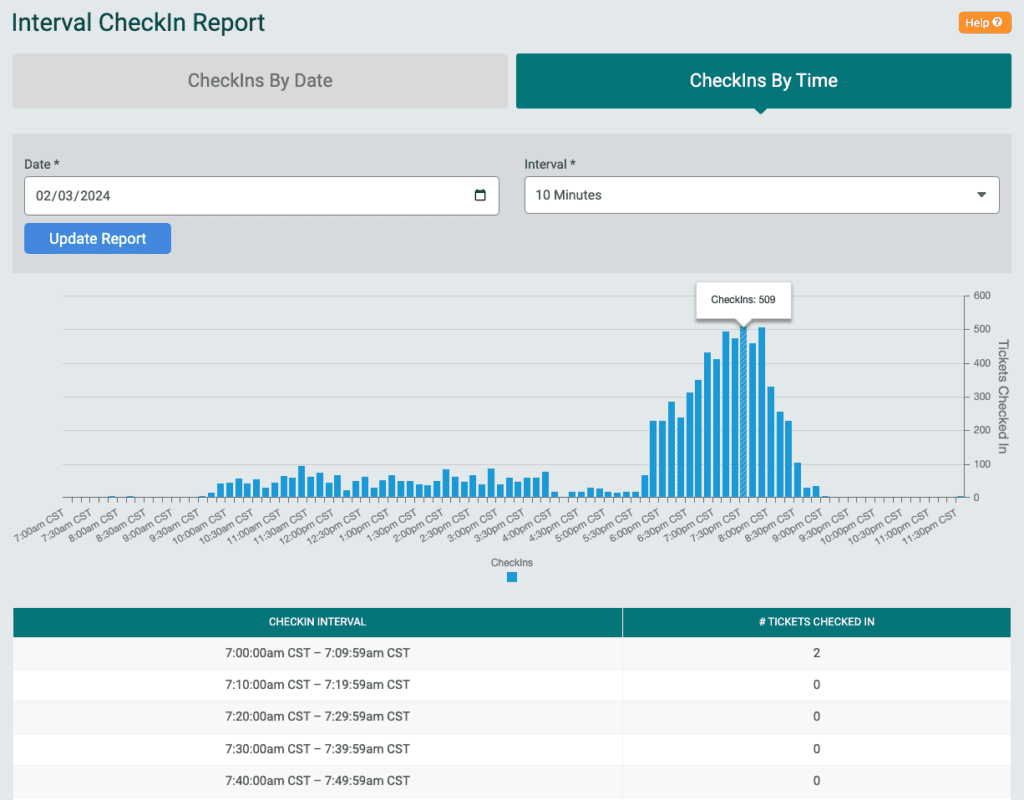
One of TicketSignup’s most popular features is the free mobile Ticket App. From scanning tickets to fulfilling merch on site, the Ticket App make events simple and smooth. The CheckIns by Ticket Report lets you view stats on checkins vs. purchased tickets for all tickets, and broken down by ticket type. The CheckIn Interval Report lets you drill down into 5, 10, 30, or 60 minute intervals to view the total number of check-ins throughout the event. In addition, you can export a summary of the intervals and checkin count. This helps you better understand throughput and when you need more (or fewer) staff.
Sales Tax
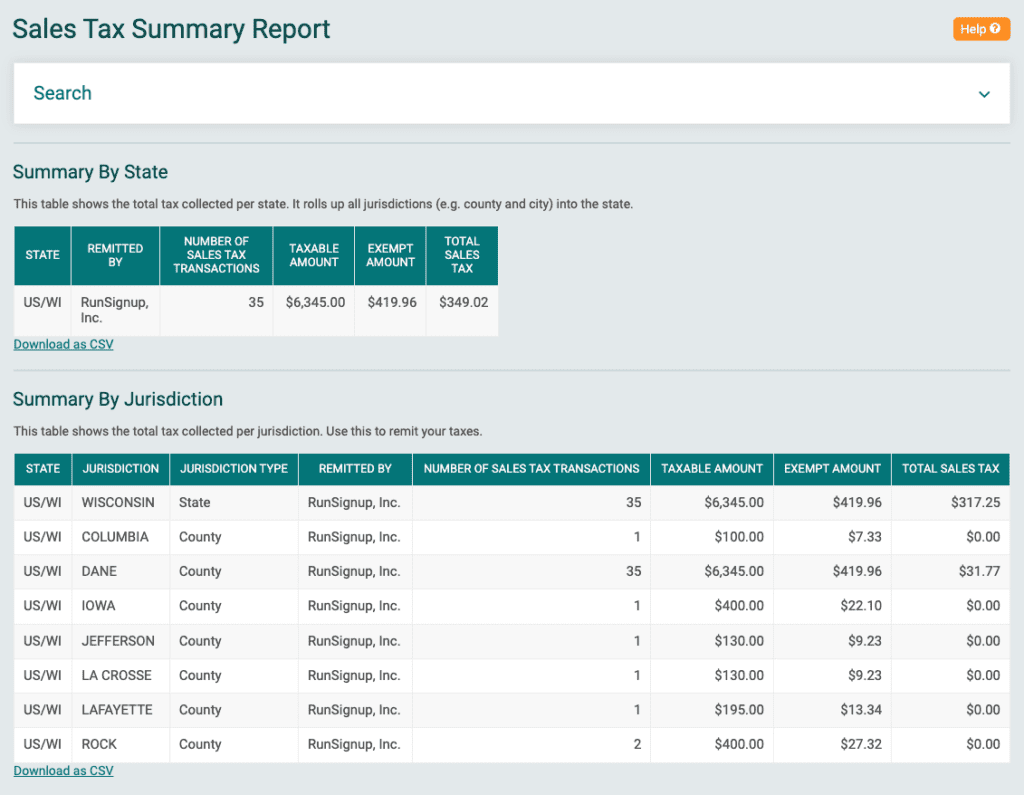
TicketSignup automatically calculates, collects, and remits sales tax on behalf of your event. The Sales Tax summary report gives you a breakdown by state, county, and jurisdiction. You can also specify a date range to search. The summary report, in addition to the line item sales tax reports, can be used if your organization is audited.
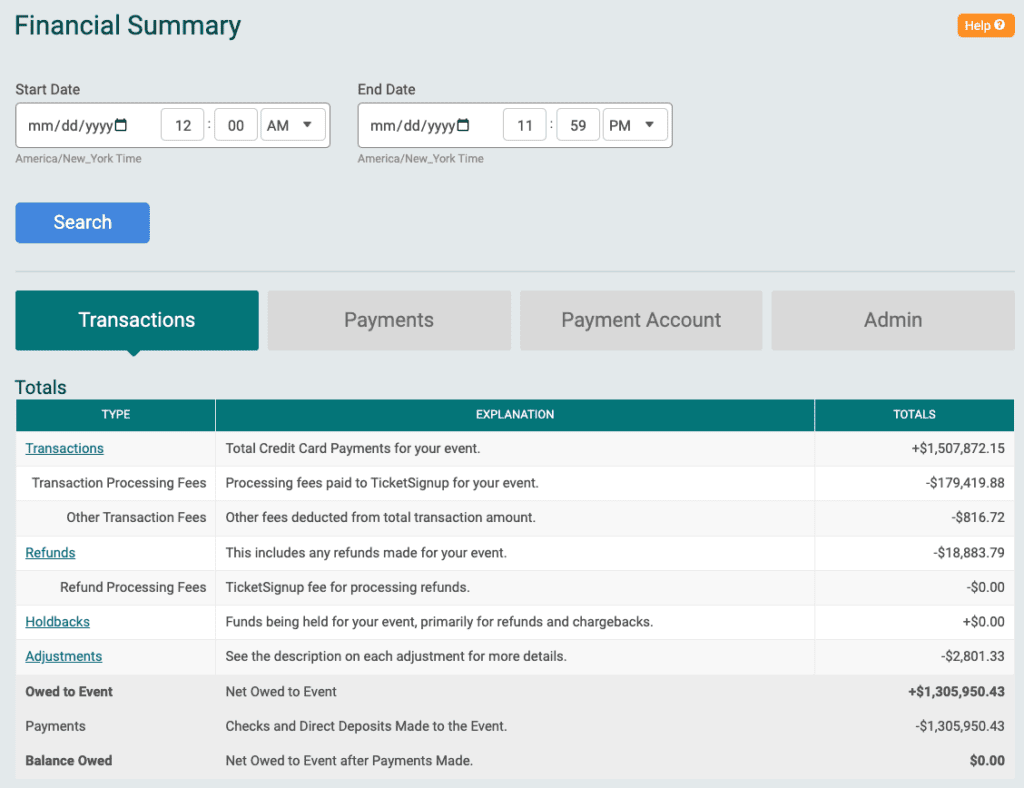
Financial Summary
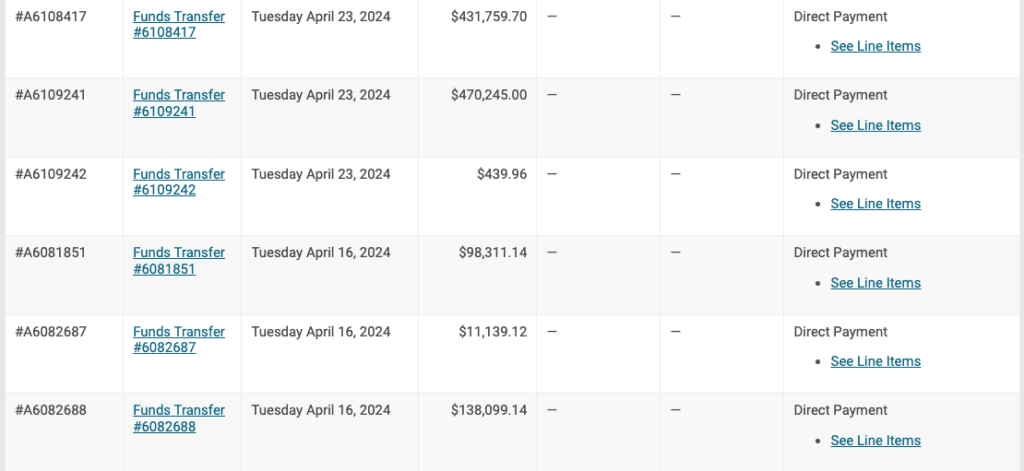
TicketSignup makes your event finances simple with reconciled payment reports. The Financial Summary rolls up your event finances with quick links to drill into detailed reports. You can also view a payments summary report that gives you quick data on the payment amount per transfer to your bank account, as well as links to view detailed reconciliation reports.