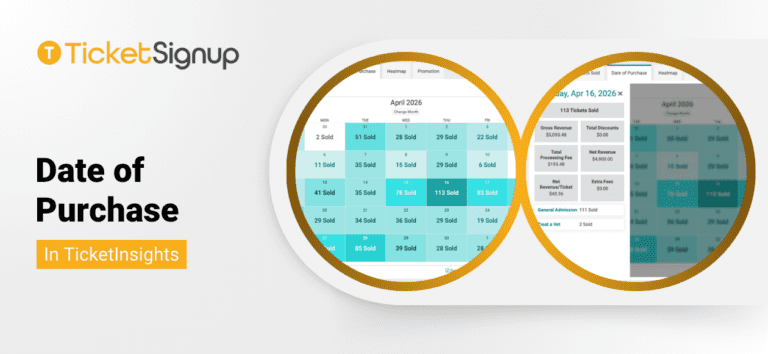
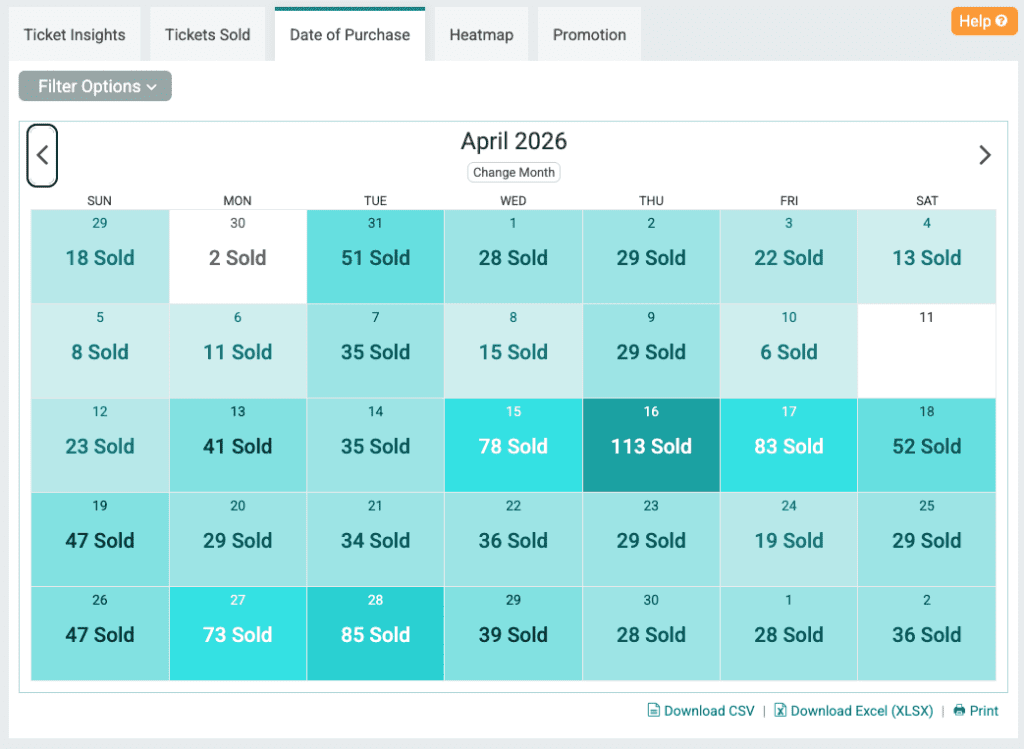
The new Date of Purchase report in TicketInsights gives you a clear view of your sales by purchase date. The month view shows tickets sold each day in a calendar heatmap. Darker shading = bigger sales days, so peaks, slow stretches, and weekly rhythms jump out at a glance. Use the arrows to move between months, or jump to a specific month with the Change Month picker.
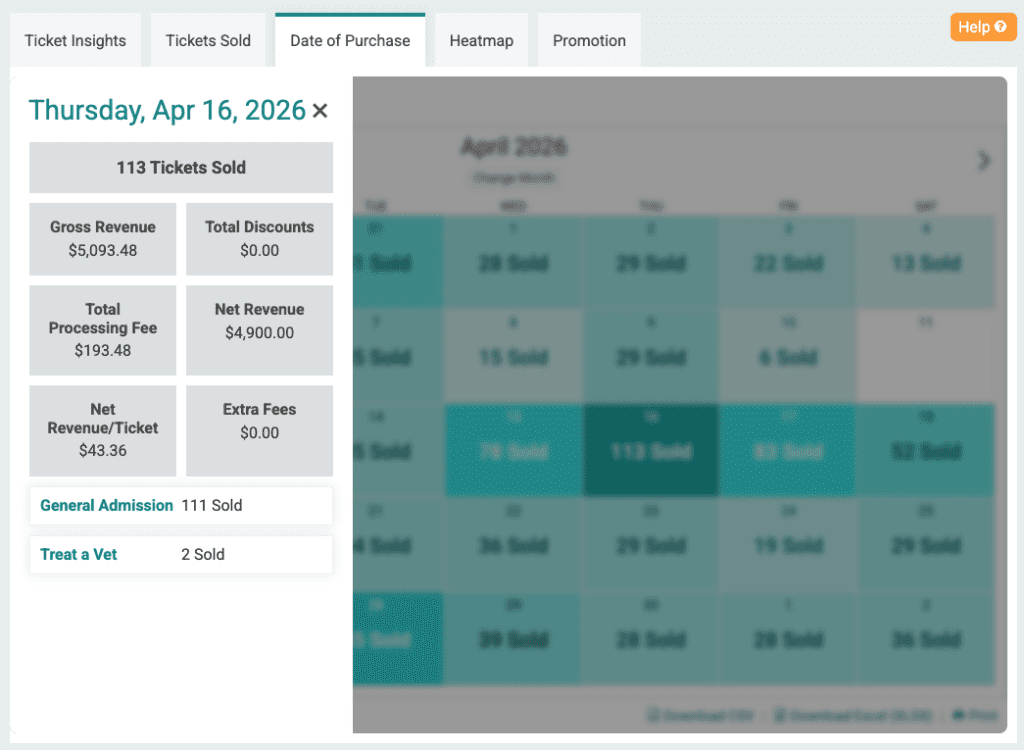
Select a date to open the day view, where you’ll see:
- Total tickets sold
- Gross revenue, total discounts, processing fees, and net revenue
- Net revenue per ticket
- Sales broken out by ticket type
The Date of Purchase report helps you tie marketing activity to results. Did a Facebook ad push, email send, or early-bird deadline drive a spike? Are weekends quieter than weekdays? Are sales accelerating as event day approaches, or stalling? With this view, you can plan smarter promotion timing, evaluate which campaigns actually moved tickets, and forecast more accurately based on your real buying patterns.