Whether you’re managing a farm tour, immersive museum exhibit, light show, or city trolley experience, running a timed entry event means keeping track of hundreds of moving parts across days, times, and ticket types. You need more than static spreadsheets and generic reports.
TicketSignup’s calendar-based reporting delivers real-time visibility and intuitive tools to help you manage capacity, enhance operations, make more money, and make smarter decisions. Here’s how timed entry events of all sizes unlock actionable insights with calendar-based reporting tools.
Clearer Views, Smarter Days: Calendar Summary Reports
Calendar-based reporting gives you easy-to-digest monthly overviews and detailed daily breakdowns across a variety of reports. These insights help you identify trends, optimize marketing efforts, track revenue, and make informed staffing decisions—so you can manage your event and operations with confidence.
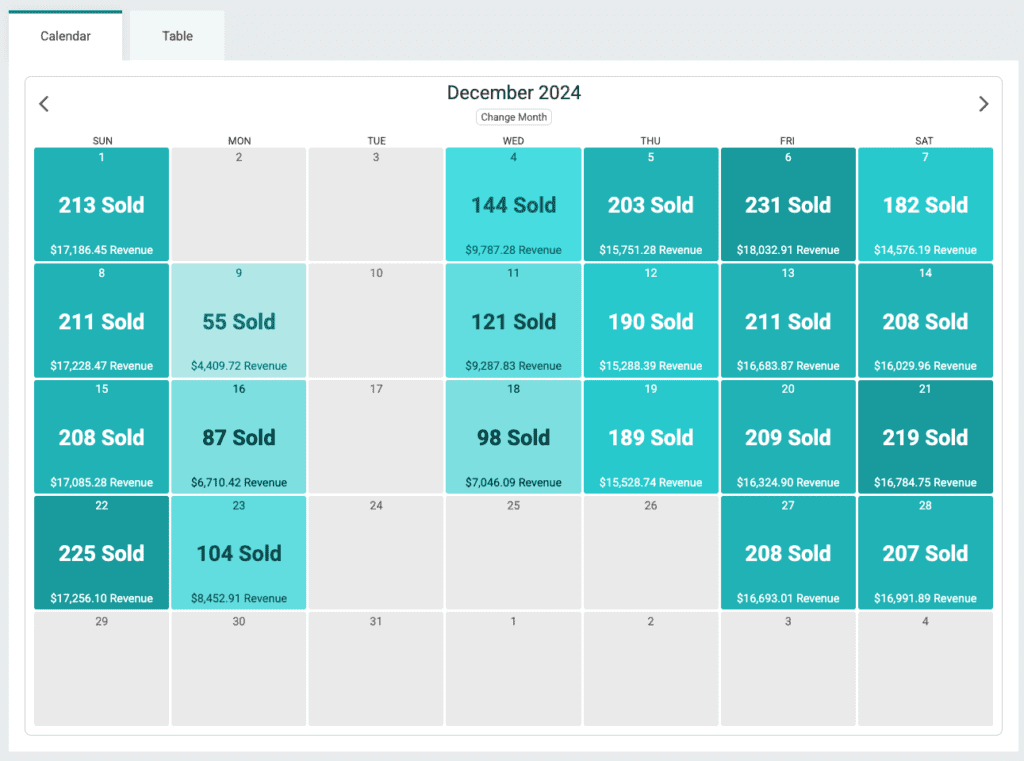
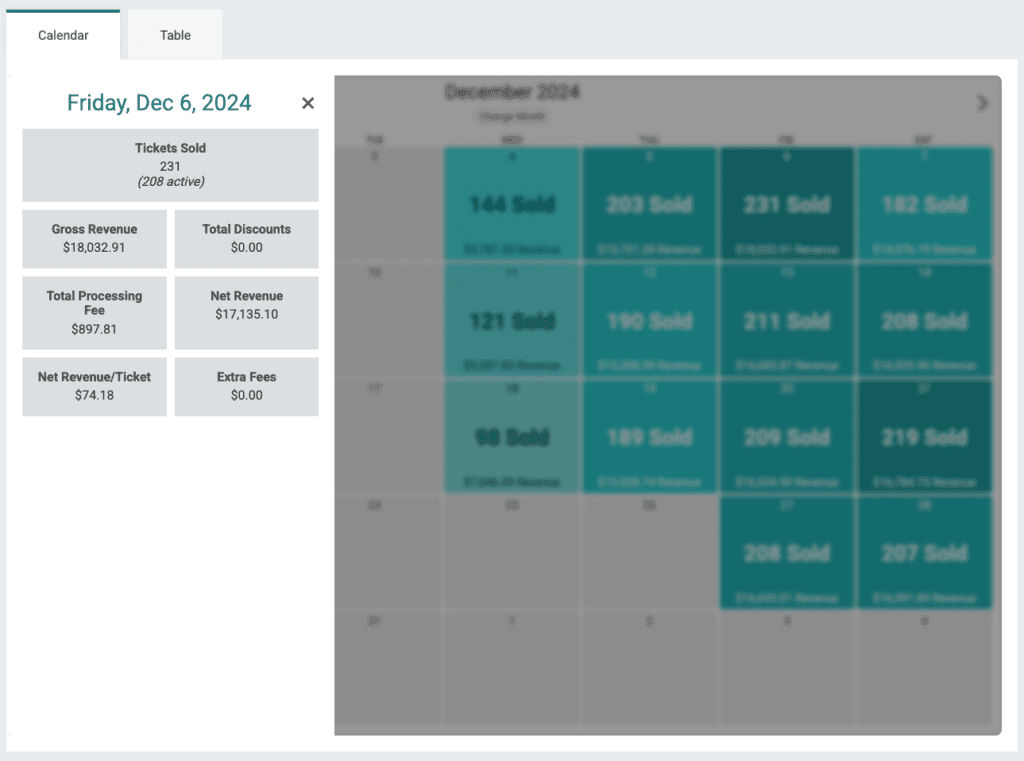
Ticket Date Sales Summary Report
Monitor ticket sales and revenue for each date your event runs. For example, easily see how many tickets were purchased for a specific day, like September 15.
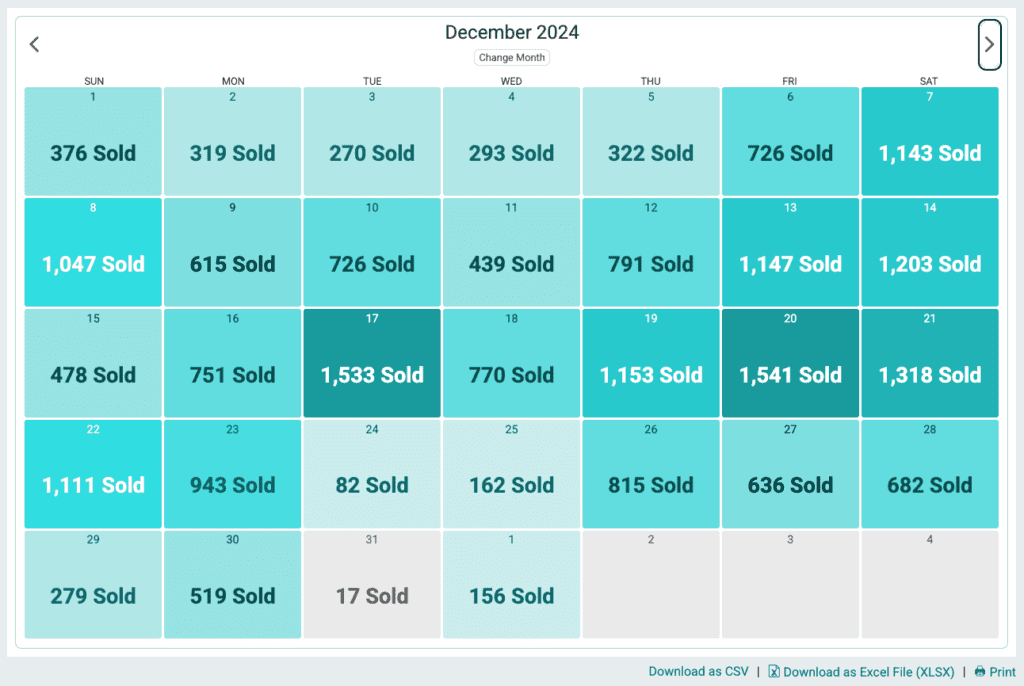
Date of Purchase Report
Track how many tickets attendees purchased per day. This lets you zoom out to look at peak purchase times and other purchasing trends.
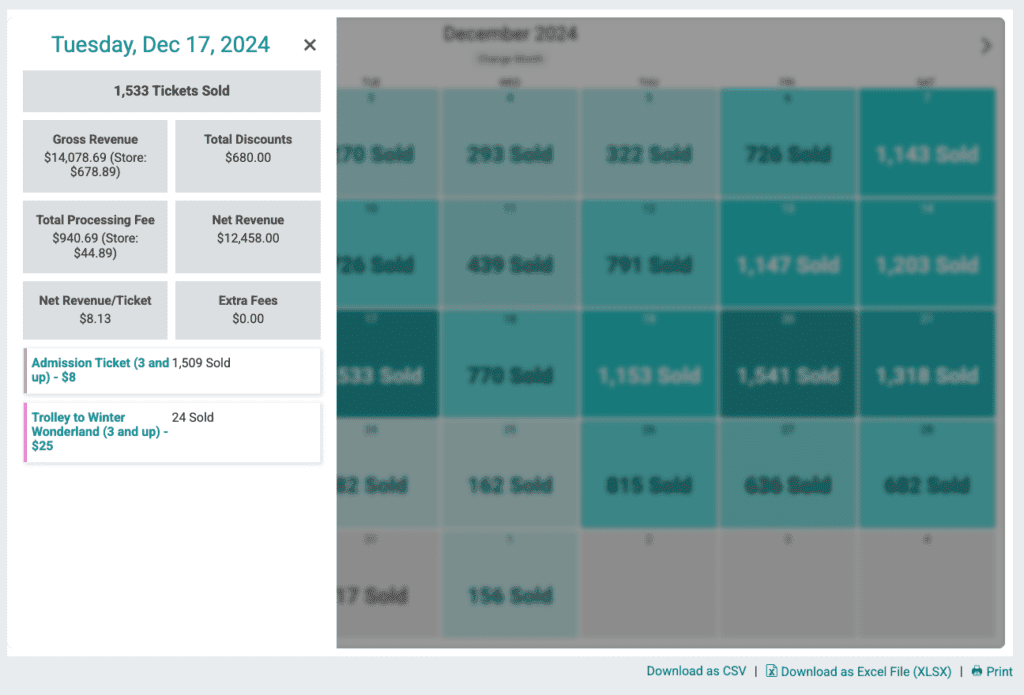
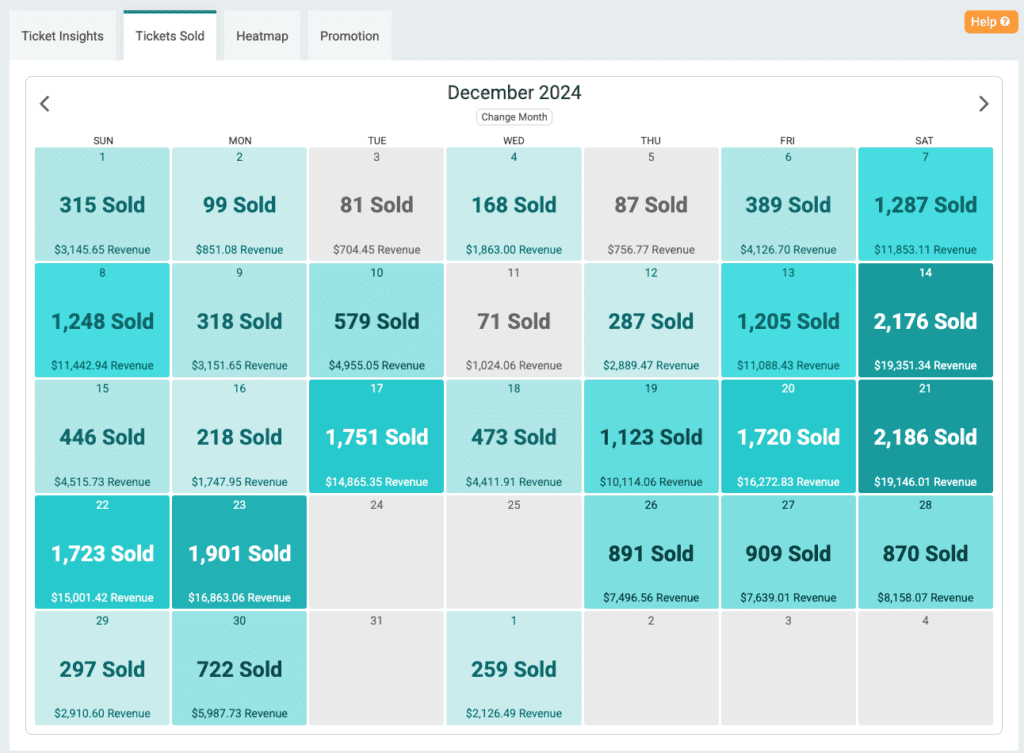
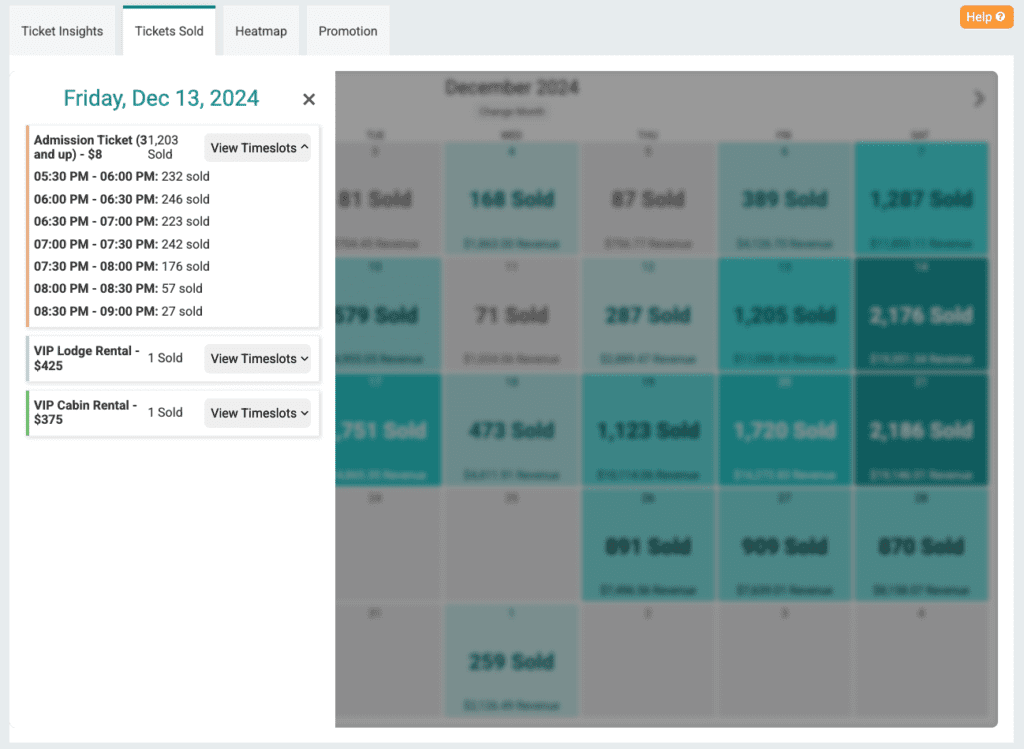
Tickets Sold
Right on your dashboard, you can track how many tickets have been sold. As this report focuses on the number of tickets sold, you can also dig into tickets sold per time slot.
Scan, Tap, Done: CheckIn Insights in and from the Ticket App
Swipe across ticket types to track check-ins by time slot via the Ticket App. Don’t want all of your staff seeing overall stats? You can hide stats and only show to those you want to see.


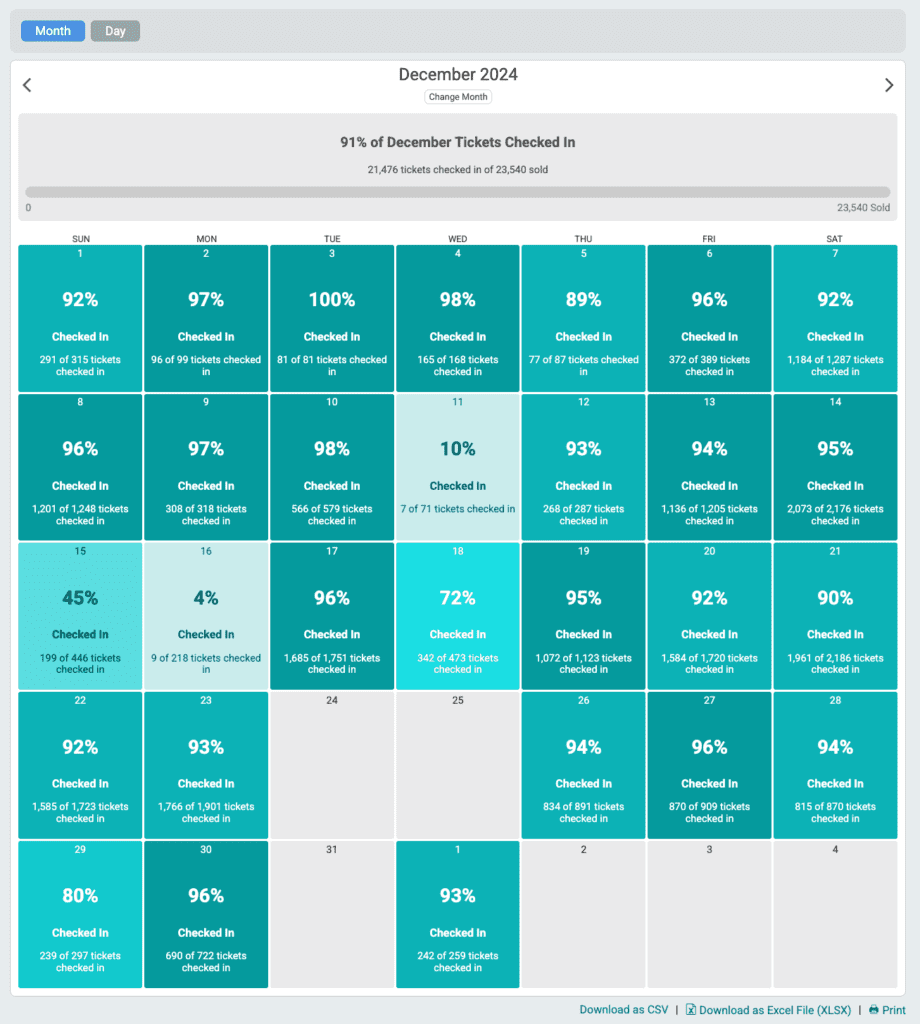
CheckIn Stats Month and Day Views
Get a comprehensive overview of check-ins across your entire event schedule. Use this data to fine-tune capacity limits and pricing for both current and future events. Click into any date to view detailed check-in metrics—by time slot, ticket type, and total daily check-ins. With a unique URL, you can refresh this page in real time throughout the day or evening.
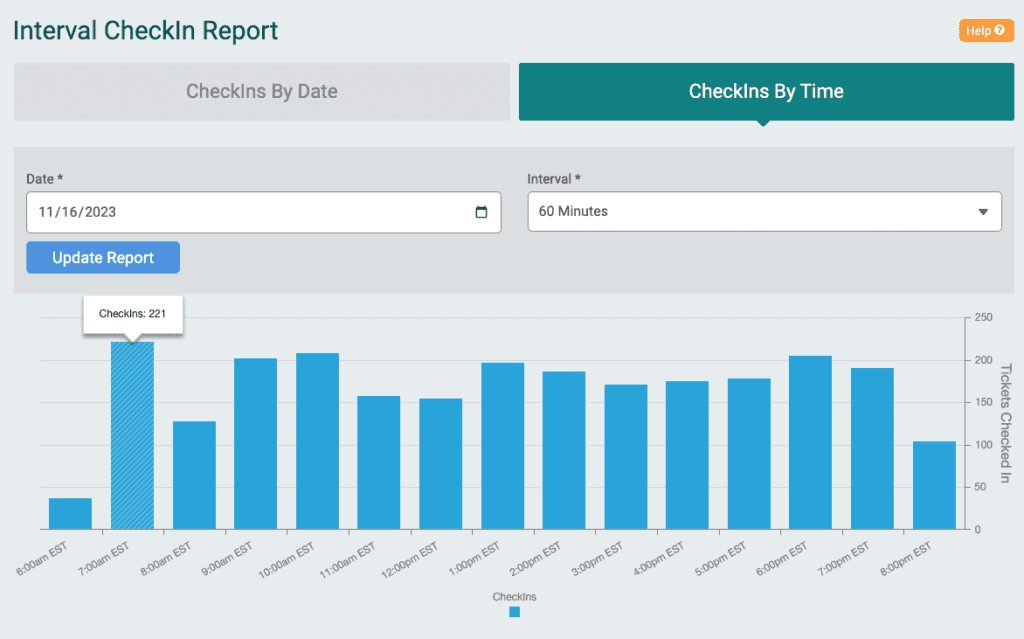
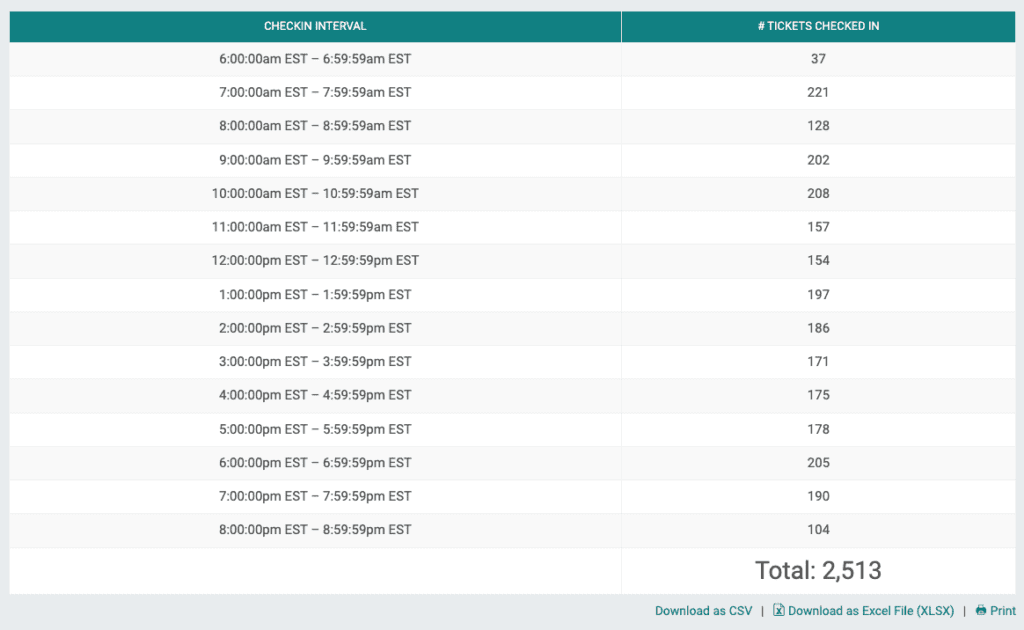
CheckIn Interval Report
Dig into the volume of check-ins by time. Choose a date and interval – hourly, 30 minute, 10 minute, and 5 minute intervals are available.
Actionable Analytics: Insights That Power Smarter Events
TicketSignup’s built-in analytics engine gives you deeper visibility into your event performance. Track key metrics like traffic sources, conversions, and device usage—all in one place. Plus, connect with tools like Google Analytics (GA4), Facebook’s Conversion API, TikTok Pixel, and more for enhanced ad tracking and campaign optimization.
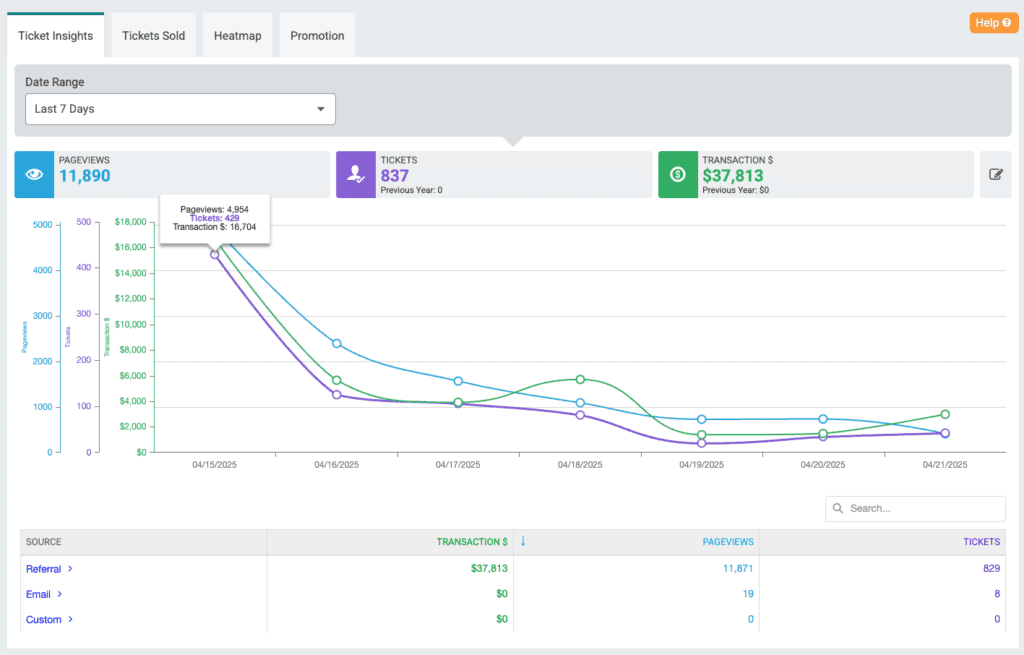
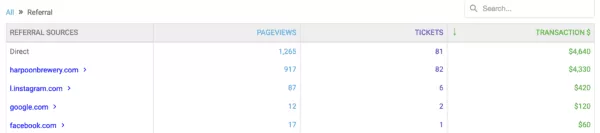
TicketInsights
Track the source of every click and purchase on your site. Understand which sites and emails drive the most traffic and the highest ticket sale conversions. You can also set up custom source tracking to generate your own links and attach to digital ads, giving you a balance between cookies used by Google, Meta, etc. and TicketSignup’s last-click attribution.
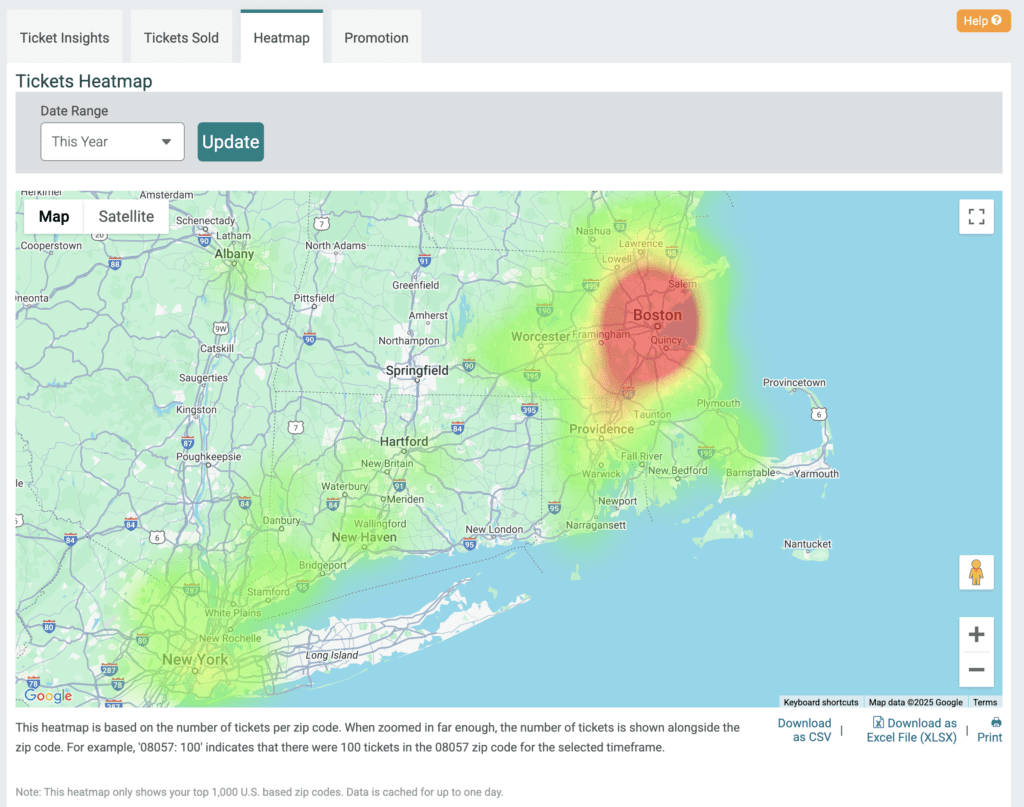
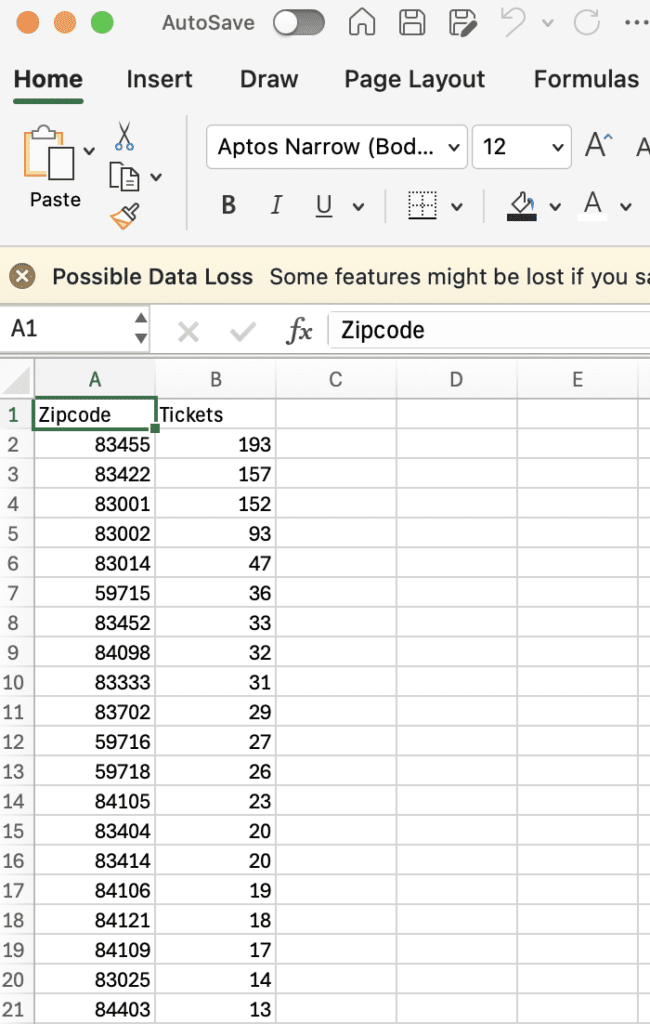
Heatmap
Understand where your attendees come from with our exportable Heatmap. Zoom in and out. Export a CSV that gives you number of tickets sold by zipcode.
Saved Reports: Customizable Reporting to View and Export Your Event Data
TicketSignup’s reporting tools are designed to be both actionable and adaptable. Each report includes direct links to manage ticket purchases and offers powerful filtering and customization options. With Saved Reports, you can choose the columns, filters, and data order that matter most—making it easy to view and export the insights that keep your event running smoothly.

