

What is TicketInsights?
TicketInsights is like a custom Google Analytics designed specifically for ticket events. You can find your TicketInsights reports right on your event dashboard – dive in to learn how to get your data to work for you.
Overview Reports
Your Overview Report is the first set of graphs and numbers on your dashboard. The top graph shows you the pattern of conversions on your site (defaulting to the previous 7 days, but with customizable date ranges).
What Conversions Does TicketInsights Track?

Pageviews
Pageviews are every view of any page on your TicketSignup website

Tickets
A ticket is counted as a completed checkout

Transactions
This is the total money paid to the event (including add-ons, donations, etc.)

Ticket $
This category is the total money paid to the event for ticket prices only

Donation $
Donation $ is the money paid to the event for donations only

What Are Your Data Sources?

Referral Sources
Referral Sources are other sites (like Google and Bing, or your own non-TicketSignup website)

Email Sources
Email Sources are all emails sent from the TicketSignup system. We use the email subject line so that you can easily see which emails resulted in the highest number of website views and ticket sales.

Custom Sources
Custom Sources are sources you set up to track (see below)

Dig into your referral sources.
Track Every Marketing Action with Custom Source Tracking
Custom source tracking lets you create a unique link to your event website that can be shared for a specific marketing action – allowing you to track the exact results of every action. For example, you can create unique links for each Facebook Ad, partner email blast, and ad in your local event calendar to see how much interest and action each item takes. Make it even easier to understand your ROI by adding your budget (where applicable).

Set up of Custom Source Tracking is easier than you think – learn how to create your custom links in seconds here.
Reports for comprehensive data on your event…

Tickets Sold
Our Tickets Sold report shows you your year-over-year of total tickets sold to help you understand how your current ticket sales map onto previous patterns.
From this page, you can also see the breakdown of tickets sold by each ticket group. So you can have a birds-eye-view of which ticket offering is your most successful and you can plan your promotional strategies accordingly.
Promotional Reports
We always recommend enabling referrals for your ticket event. It’s a low risk strategy that requires only a few minutes to setup. The promotions tab on your TicketInsights dashboard shows the breakdown of your referral tickets.
See how your referrals compare with other sources and track your ROI. We compute your number of referred tickets, revenue, and cost of refunds.

Heat Map
The Heat Map is the most actionable report amongst these. While it pulls up a fun map view of where all your attendees originate, the true power is in the export at the bottom. From there, you can use the zip codes to learn more about where your attendees originate – and make better decisions about what regions you want to target all your advertising money.

Looking for More Reports?
All the Latest Blogs on Ticket Events
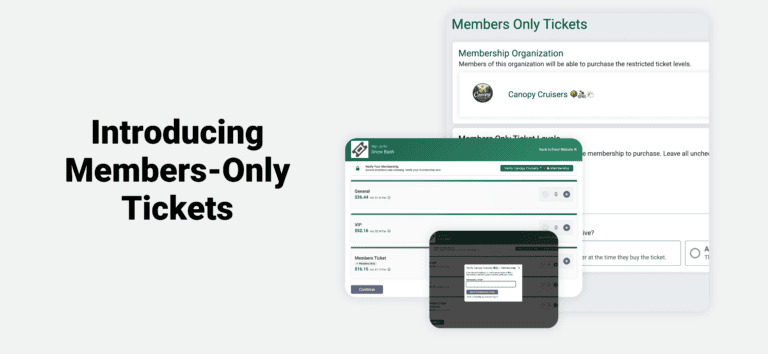
Introducing Members-Only Tickets
Members-only previews, member nights, and exclusive programs are some of the best perks a membership organization can offer. TicketSignup now lets you sell tickets that only your members can buy, with membership verified automatically at checkout. Members-Only Tickets connects your TicketSignup Memberships…
Read More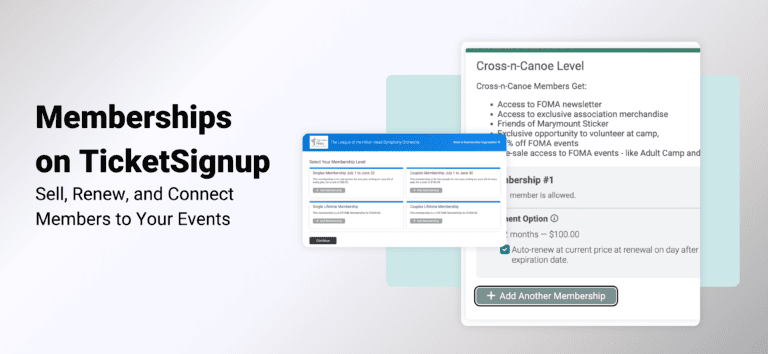
Memberships on TicketSignup: Sell, Renew, and Connect Members to Your Events
Gardens, museums, associations, clubs, and nonprofits run on members. Many of them also run events. Memberships on TicketSignup puts both on one platform, so the people who support you all year can join, renew, and get into your events with less work…
Read More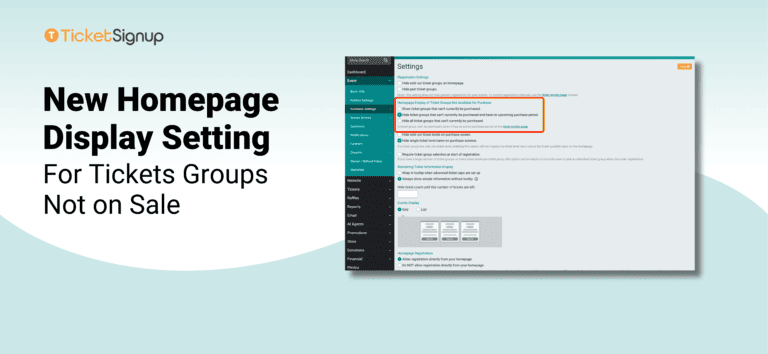
New Homepage Display Setting for Ticket Groups Not on Sale
TicketSignup gives you a wide range of settings to control how tickets appear on your event homepage, including options for sold out, tickets remaining, and past ticket groups. Simple and advanced ticket events now have one more: display settings for ticket groups…
Read More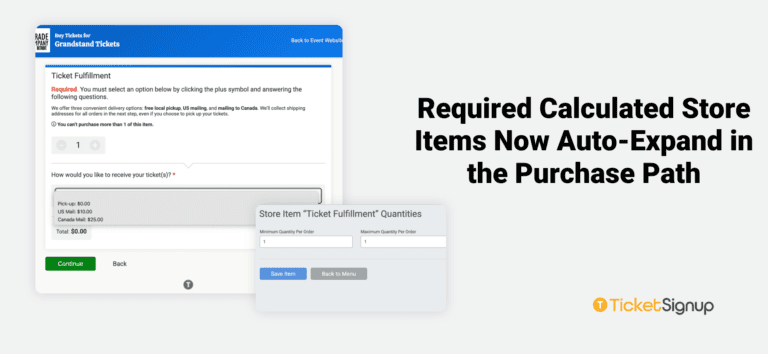
Required Calculated Store Items Now Auto-Expand in the Purchase Path
Calculated Store Items let events price add-ons dynamically based on custom question responses, while collecting the details they need at the same time. Now, when a Calculated Store Item is required, it starts selected and expanded in the purchase path. Purchasers see…
Read More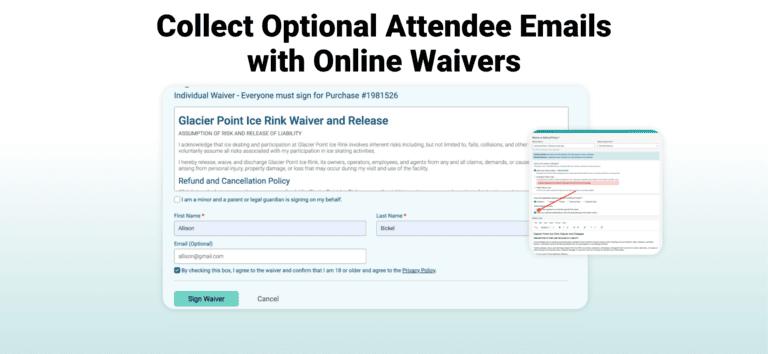
Collect Optional Attendee Emails with Online Waivers
Every attendee waiver you collect represents a real person coming to your event. Until now, the only email address tied to that ticket purchase belonged to the purchaser (unless you chose to collect email per ticket). If one person bought ten tickets,…
Read More
Coupon ROI Report
There is a new Coupon ROI Report on the ticket event dashboard. Some events leverage coupons to incentivize purchases. This might be time limited discounts, coupons for a specific date, ticket type, or store item, or coupons distributed to local businesses and…
Read More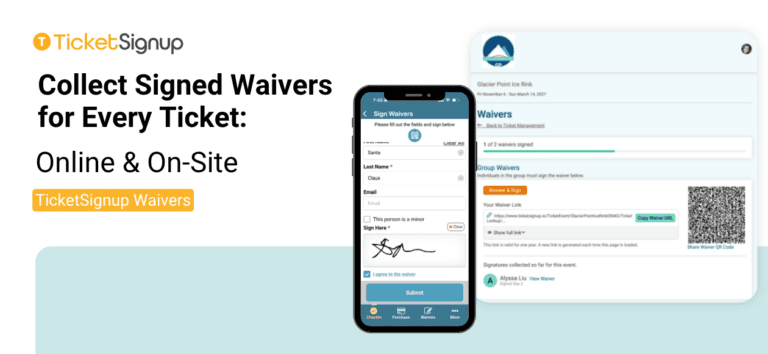
Collect Signed Waivers for Every Ticket: Online and On-Site
If your event carries physical or participation risk, a checkbox at checkout may not be enough. A real, signed waiver from every person who shows up could give you stronger protection, whether they sign ahead of time online or on-site at check-in….
Read More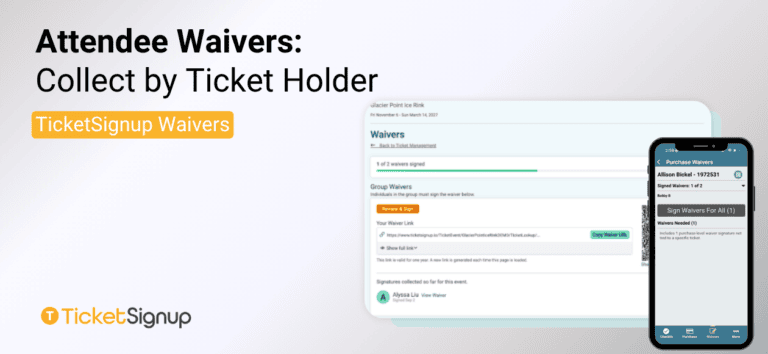
Attendee Waivers: Collect by Ticket Holder
Collect by Ticket Holder is the recommended way to collect Attendee Waivers on TicketSignup. It gives every purchase one shareable waiver link, so any ticket holder can sign, including a substitute who’s stepping in for someone who can’t make it. If your…
Read More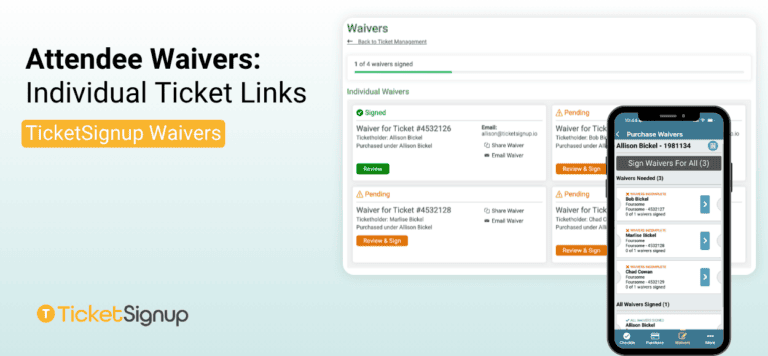
Attendee Waivers: Individual Ticket Links
Individual Ticket Links gives every ticket in a purchase its own unique signing link. Use it when a specific ticket number needs to match a specific name, and you need a signature tied to one specific ticket rather than the purchase. In…
Read More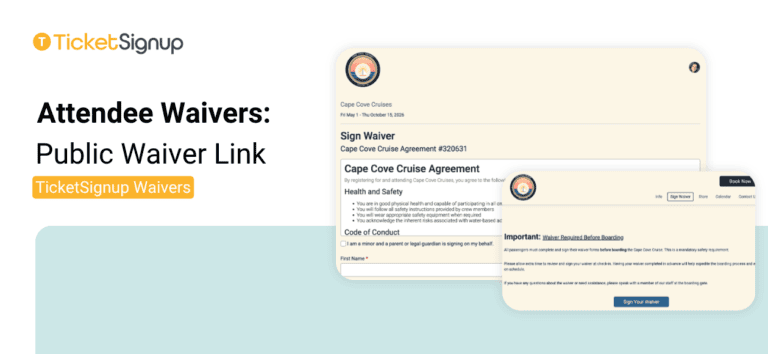
Attendee Waivers: Public Waiver Link
The Public Waiver Link is an open signing link for your event, no ticket or purchase confirmation required. Post it anywhere on your event website or distribute via email, and anyone can sign. Setup From your ticket event dashboard, open Waiver setup…
Read More
TicketSignup Product Updates: Week of August 24 – 30, 2026
We are introducing a new blog series that will summarize all of the product releases relevant to ticket events on a weekly basis. This week we shipped 29 updates relevant to TicketSignup events, adding 8,452 lines of code and removing 1,078 lines…
Read More
A Scent-sational Debut – The Perfect Timed Entry Ticketing Solution for a Perfume Festival
A Perfume Lovers’ Conference, Built From Scratch Fragrance Fête, French for “festival,” brings together perfume enthusiasts, collectors, and industry brands and perfumers for a celebration of fragrances in New Orleans. Adriana Herrman, co-creator and co-organizer of the event, isn’t a traditional event…
Read More